Immigrants from South America vs Australian Per Capita Income
COMPARE
Immigrants from South America
Australian
Per Capita Income
Per Capita Income Comparison
Immigrants from South America
Australians
$44,068
PER CAPITA INCOME
61.2/ 100
METRIC RATING
163rd/ 347
METRIC RANK
$52,074
PER CAPITA INCOME
100.0/ 100
METRIC RATING
33rd/ 347
METRIC RANK
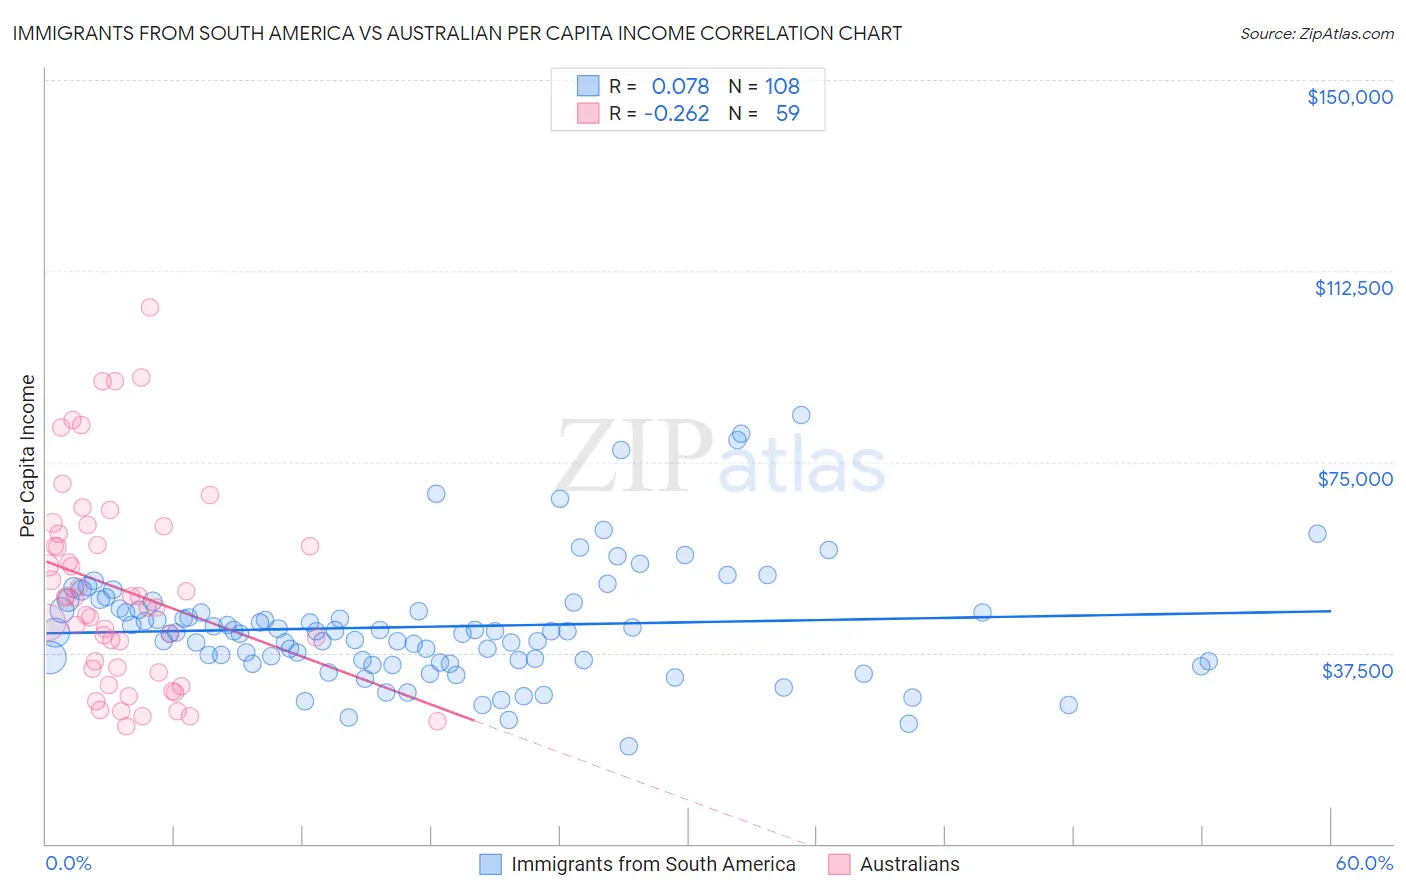
Immigrants from South America vs Australian Per Capita Income Correlation Chart
The statistical analysis conducted on geographies consisting of 486,454,612 people shows a slight positive correlation between the proportion of Immigrants from South America and per capita income in the United States with a correlation coefficient (R) of 0.078 and weighted average of $44,068. Similarly, the statistical analysis conducted on geographies consisting of 224,126,696 people shows a weak negative correlation between the proportion of Australians and per capita income in the United States with a correlation coefficient (R) of -0.262 and weighted average of $52,074, a difference of 18.2%.
Per Capita Income Correlation Summary
| Measurement | Immigrants from South America | Australian |
| Minimum | $19,195 | $23,081 |
| Maximum | $84,313 | $105,254 |
| Range | $65,118 | $82,173 |
| Mean | $42,614 | $49,891 |
| Median | $41,568 | $48,296 |
| Interquartile 25% (IQ1) | $35,887 | $34,284 |
| Interquartile 75% (IQ3) | $46,069 | $60,948 |
| Interquartile Range (IQR) | $10,183 | $26,664 |
| Standard Deviation (Sample) | $11,625 | $19,453 |
| Standard Deviation (Population) | $11,572 | $19,287 |
Similar Demographics by Per Capita Income
Demographics Similar to Immigrants from South America by Per Capita Income
In terms of per capita income, the demographic groups most similar to Immigrants from South America are Swiss ($44,076, a difference of 0.020%), Costa Rican ($44,090, a difference of 0.050%), Danish ($44,095, a difference of 0.060%), South American ($44,114, a difference of 0.10%), and Sri Lankan ($44,014, a difference of 0.12%).
| Demographics | Rating | Rank | Per Capita Income |
| Slovaks | 65.4 /100 | #156 | Good $44,229 |
| South American Indians | 64.8 /100 | #157 | Good $44,206 |
| Immigrants | Nepal | 64.3 /100 | #158 | Good $44,187 |
| South Americans | 62.4 /100 | #159 | Good $44,114 |
| Danes | 61.9 /100 | #160 | Good $44,095 |
| Costa Ricans | 61.8 /100 | #161 | Good $44,090 |
| Swiss | 61.4 /100 | #162 | Good $44,076 |
| Immigrants | South America | 61.2 /100 | #163 | Good $44,068 |
| Sri Lankans | 59.8 /100 | #164 | Average $44,014 |
| Immigrants | Philippines | 59.4 /100 | #165 | Average $44,000 |
| Immigrants | Uruguay | 59.3 /100 | #166 | Average $43,997 |
| English | 58.9 /100 | #167 | Average $43,982 |
| Belgians | 58.1 /100 | #168 | Average $43,951 |
| Immigrants | Peru | 55.3 /100 | #169 | Average $43,852 |
| Scandinavians | 55.2 /100 | #170 | Average $43,848 |
Demographics Similar to Australians by Per Capita Income
In terms of per capita income, the demographic groups most similar to Australians are Immigrants from Russia ($52,044, a difference of 0.060%), Burmese ($52,005, a difference of 0.13%), Immigrants from Norway ($52,217, a difference of 0.27%), Immigrants from Greece ($51,891, a difference of 0.35%), and Estonian ($51,875, a difference of 0.38%).
| Demographics | Rating | Rank | Per Capita Income |
| Russians | 100.0 /100 | #26 | Exceptional $53,154 |
| Immigrants | South Central Asia | 100.0 /100 | #27 | Exceptional $52,660 |
| Latvians | 100.0 /100 | #28 | Exceptional $52,649 |
| Israelis | 100.0 /100 | #29 | Exceptional $52,596 |
| Immigrants | Austria | 100.0 /100 | #30 | Exceptional $52,503 |
| Turks | 100.0 /100 | #31 | Exceptional $52,391 |
| Immigrants | Norway | 100.0 /100 | #32 | Exceptional $52,217 |
| Australians | 100.0 /100 | #33 | Exceptional $52,074 |
| Immigrants | Russia | 100.0 /100 | #34 | Exceptional $52,044 |
| Burmese | 100.0 /100 | #35 | Exceptional $52,005 |
| Immigrants | Greece | 100.0 /100 | #36 | Exceptional $51,891 |
| Estonians | 100.0 /100 | #37 | Exceptional $51,875 |
| Immigrants | Czechoslovakia | 100.0 /100 | #38 | Exceptional $51,770 |
| Cambodians | 100.0 /100 | #39 | Exceptional $51,731 |
| Immigrants | Korea | 100.0 /100 | #40 | Exceptional $51,671 |