Immigrants from Austria vs Australian Per Capita Income

COMPARE

Immigrants from Austria
Race
Ancestry
AfghanAfricanAlaska NativeAlaskan AthabascanAlbanianAleutAlsatianAmericanApacheArabArapahoArgentineanArmenianAssyrian/Chaldean/SyriacAustrianBahamianBangladeshiBarbadianBasqueBelgianBelizeanBermudanBhutaneseBlackfeetBolivianBrazilianBritishBritish West IndianBulgarianBurmeseCajunCambodianCanadianCape VerdeanCarpatho RusynCelticCentral AmericanCentral American IndianCherokeeCheyenneChickasawChileanChineseChippewaChoctawColombianColvilleComancheCosta RicanCreeCreekCroatianCrowCubanCypriotCzechCzechoslovakianDanishDelawareDominicanDutchDutch West IndianEastern EuropeanEcuadorianEgyptianEnglishEstonianEthiopianEuropeanFijianFilipinoFinnishFrenchFrench American IndianFrench CanadianGermanGerman RussianGhanaianGreekGuamanian/ChamorroGuatemalanGuyaneseHaitianHmongHonduranHopiHoumaHungarianIcelanderIndian (Asian)IndonesianInupiatIranianIraqiIrishIroquoisIsraeliItalianJamaicanJapaneseJordanianKenyanKiowaKoreanLaotianLatvianLebaneseLiberianLithuanianLumbeeLuxembourgerMacedonianMalaysianMalteseMarshalleseMenomineeMexicanMexican American IndianMongolianMoroccanNative HawaiianNavajoNepaleseNew ZealanderNicaraguanNigerianNorthern EuropeanNorwegianOkinawanOsageOttawaPaiutePakistaniPalestinianPanamanianParaguayanPennsylvania GermanPeruvianPimaPolishPortuguesePotawatomiPuebloPuerto RicanPuget Sound SalishRomanianRussianSalvadoranSamoanScandinavianScotch-IrishScottishSeminoleSenegaleseSerbianShoshoneSierra LeoneanSiouxSlavicSlovakSloveneSomaliSouth AfricanSouth AmericanSouth American IndianSoviet UnionSpaniardSpanishSpanish AmericanSpanish American IndianSri LankanSubsaharan AfricanSudaneseSwedishSwissSyrianTaiwaneseThaiTlingit-HaidaTohono O'OdhamTonganTrinidadian and TobagonianTsimshianTurkishU.S. Virgin IslanderUgandanUkrainianUruguayanUteVenezuelanVietnameseWelshWest IndianYakamaYaquiYugoslavianYumanYup'ikZimbabwean
Immigration
NonimmigrantsImmigrantsAfghanistanAfricaAlbaniaArgentinaArmeniaAsiaAustraliaAustriaBahamasBangladeshBarbadosBelarusBelgiumBelizeBoliviaBosnia and HerzegovinaBrazilBulgariaBurma/MyanmarCabo VerdeCambodiaCameroonCanadaCaribbeanCentral AmericaChileChinaColombiaCongoCosta RicaCroatiaCubaCzechoslovakiaDenmarkDominicaDominican RepublicEastern AfricaEastern AsiaEastern EuropeEcuadorEgyptEl SalvadorEnglandEritreaEthiopiaEuropeFijiFranceGermanyGhanaGreeceGrenadaGuatemalaGuyanaHaitiHondurasHong KongHungaryIndiaIndonesiaIranIraqIrelandIsraelItalyJamaicaJapanJordanKazakhstanKenyaKoreaKuwaitLaosLatin AmericaLatviaLebanonLiberiaLithuaniaMalaysiaMexicoMicronesiaMiddle AfricaMoldovaMoroccoNepalNetherlandsNicaraguaNigeriaNorth AmericaNorth MacedoniaNorthern AfricaNorthern EuropeNorwayOceaniaPakistanPanamaPeruPhilippinesPolandPortugalRomaniaRussiaSaudi ArabiaScotlandSenegalSerbiaSierra LeoneSingaporeSomaliaSouth AfricaSouth AmericaSouth Central AsiaSouth Eastern AsiaSouthern EuropeSpainSri LankaSt. Vincent and the GrenadinesSudanSwedenSwitzerlandSyriaTaiwanThailandTrinidad and TobagoTurkeyUgandaUkraineUruguayUzbekistanVenezuelaVietnamWest IndiesWestern AfricaWestern AsiaWestern EuropeYemenZaireZimbabweAzores
Australian
Race
Ancestry
AfghanAfricanAlaska NativeAlaskan AthabascanAlbanianAleutAlsatianAmericanApacheArabArapahoArgentineanArmenianAssyrian/Chaldean/SyriacAustralianAustrianBahamianBangladeshiBarbadianBasqueBelgianBelizeanBermudanBhutaneseBlackfeetBolivianBrazilianBritishBritish West IndianBulgarianBurmeseCajunCambodianCanadianCape VerdeanCarpatho RusynCelticCentral AmericanCentral American IndianCherokeeCheyenneChickasawChileanChineseChippewaChoctawColombianColvilleComancheCosta RicanCreeCreekCroatianCrowCubanCypriotCzechCzechoslovakianDanishDelawareDominicanDutchDutch West IndianEastern EuropeanEcuadorianEgyptianEnglishEstonianEthiopianEuropeanFijianFilipinoFinnishFrenchFrench American IndianFrench CanadianGermanGerman RussianGhanaianGreekGuamanian/ChamorroGuatemalanGuyaneseHaitianHmongHonduranHopiHoumaHungarianIcelanderIndian (Asian)IndonesianInupiatIranianIraqiIrishIroquoisIsraeliItalianJamaicanJapaneseJordanianKenyanKiowaKoreanLaotianLatvianLebaneseLiberianLithuanianLumbeeLuxembourgerMacedonianMalaysianMalteseMarshalleseMenomineeMexicanMexican American IndianMongolianMoroccanNative HawaiianNavajoNepaleseNew ZealanderNicaraguanNigerianNorthern EuropeanNorwegianOkinawanOsageOttawaPaiutePakistaniPalestinianPanamanianParaguayanPennsylvania GermanPeruvianPimaPolishPortuguesePotawatomiPuebloPuerto RicanPuget Sound SalishRomanianRussianSalvadoranSamoanScandinavianScotch-IrishScottishSeminoleSenegaleseSerbianShoshoneSierra LeoneanSiouxSlavicSlovakSloveneSomaliSouth AfricanSouth AmericanSouth American IndianSoviet UnionSpaniardSpanishSpanish AmericanSpanish American IndianSri LankanSubsaharan AfricanSudaneseSwedishSwissSyrianTaiwaneseThaiTlingit-HaidaTohono O'OdhamTonganTrinidadian and TobagonianTsimshianTurkishU.S. Virgin IslanderUgandanUkrainianUruguayanUteVenezuelanVietnameseWelshWest IndianYakamaYaquiYugoslavianYumanYup'ikZimbabwean
Immigration
NonimmigrantsImmigrantsAfghanistanAfricaAlbaniaArgentinaArmeniaAsiaAustraliaBahamasBangladeshBarbadosBelarusBelgiumBelizeBoliviaBosnia and HerzegovinaBrazilBulgariaBurma/MyanmarCabo VerdeCambodiaCameroonCanadaCaribbeanCentral AmericaChileChinaColombiaCongoCosta RicaCroatiaCubaCzechoslovakiaDenmarkDominicaDominican RepublicEastern AfricaEastern AsiaEastern EuropeEcuadorEgyptEl SalvadorEnglandEritreaEthiopiaEuropeFijiFranceGermanyGhanaGreeceGrenadaGuatemalaGuyanaHaitiHondurasHong KongHungaryIndiaIndonesiaIranIraqIrelandIsraelItalyJamaicaJapanJordanKazakhstanKenyaKoreaKuwaitLaosLatin AmericaLatviaLebanonLiberiaLithuaniaMalaysiaMexicoMicronesiaMiddle AfricaMoldovaMoroccoNepalNetherlandsNicaraguaNigeriaNorth AmericaNorth MacedoniaNorthern AfricaNorthern EuropeNorwayOceaniaPakistanPanamaPeruPhilippinesPolandPortugalRomaniaRussiaSaudi ArabiaScotlandSenegalSerbiaSierra LeoneSingaporeSomaliaSouth AfricaSouth AmericaSouth Central AsiaSouth Eastern AsiaSouthern EuropeSpainSri LankaSt. Vincent and the GrenadinesSudanSwedenSwitzerlandSyriaTaiwanThailandTrinidad and TobagoTurkeyUgandaUkraineUruguayUzbekistanVenezuelaVietnamWest IndiesWestern AfricaWestern AsiaWestern EuropeYemenZaireZimbabweAzores
Per Capita Income
Income
Poverty
Unemployment
Labor Participation
Family Structure
Vehicle Availability
Education Level
Disability

Per Capita Income Comparison

Immigrants from Austria

Australians

Exceptional
Exceptional
$52,503
PER CAPITA INCOME
100.0/ 100
METRIC RATING
30th/ 347
METRIC RANK
$52,074
PER CAPITA INCOME
100.0/ 100
METRIC RATING
33rd/ 347
METRIC RANK

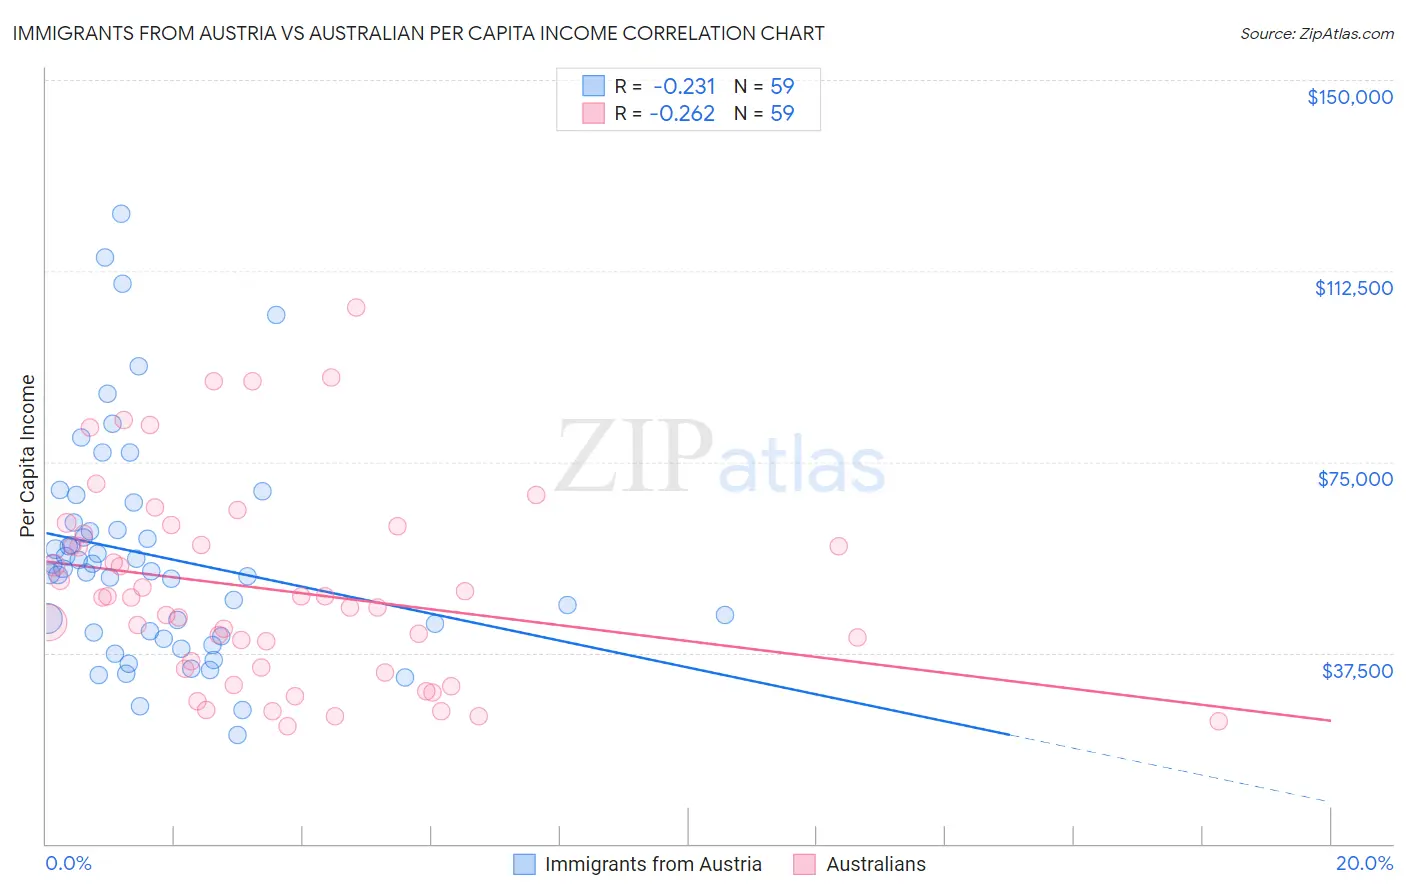
Immigrants from Austria vs Australian Per Capita Income Correlation Chart

The statistical analysis conducted on geographies consisting of 167,970,589 people shows a weak negative correlation between the proportion of Immigrants from Austria and per capita income in the United States with a correlation coefficient (R) of -0.231 and weighted average of $52,503. Similarly, the statistical analysis conducted on geographies consisting of 224,126,696 people shows a weak negative correlation between the proportion of Australians and per capita income in the United States with a correlation coefficient (R) of -0.262 and weighted average of $52,074, a difference of 0.82%.
Immigrants from Austria vs Australian Per Capita Income

Per Capita Income Correlation Summary

MeasurementImmigrants from AustriaAustralian
Minimum$21,347$23,081
Maximum$123,682$105,254
Range$102,335$82,173
Mean$56,412$49,891
Median$53,535$48,296
Interquartile 25% (IQ1)$40,769$34,284
Interquartile 75% (IQ3)$63,066$60,948
Interquartile Range (IQR)$22,297$26,664
Standard Deviation (Sample)$21,800$19,453
Standard Deviation (Population)$21,614$19,287

Demographics Similar to Immigrants from Austria and Australians by Per Capita Income

In terms of per capita income, the demographic groups most similar to Immigrants from Austria are Israeli ($52,596, a difference of 0.18%), Turkish ($52,391, a difference of 0.21%), Latvian ($52,649, a difference of 0.28%), Immigrants from South Central Asia ($52,660, a difference of 0.30%), and Immigrants from Norway ($52,217, a difference of 0.55%). Similarly, the demographic groups most similar to Australians are Immigrants from Russia ($52,044, a difference of 0.060%), Burmese ($52,005, a difference of 0.13%), Immigrants from Norway ($52,217, a difference of 0.27%), Immigrants from Greece ($51,891, a difference of 0.35%), and Estonian ($51,875, a difference of 0.38%).
DemographicsRating | RankPer Capita Income
Immigrants | Northern Europe
100.0
/100
|
#21
Exceptional
$54,159
Indians (Asian)
100.0
/100
|
#22
Exceptional
$53,874
Immigrants | Eastern Asia
100.0
/100
|
#23
Exceptional
$53,806
Immigrants | Denmark
100.0
/100
|
#24
Exceptional
$53,799
Immigrants | Japan
100.0
/100
|
#25
Exceptional
$53,359
Russians
100.0
/100
|
#26
Exceptional
$53,154
Immigrants | South Central Asia
100.0
/100
|
#27
Exceptional
$52,660
Latvians
100.0
/100
|
#28
Exceptional
$52,649
Israelis
100.0
/100
|
#29
Exceptional
$52,596
Immigrants | Austria
100.0
/100
|
#30
Exceptional
$52,503
Turks
100.0
/100
|
#31
Exceptional
$52,391
Immigrants | Norway
100.0
/100
|
#32
Exceptional
$52,217
Australians
100.0
/100
|
#33
Exceptional
$52,074
Immigrants | Russia
100.0
/100
|
#34
Exceptional
$52,044
Burmese
100.0
/100
|
#35
Exceptional
$52,005
Immigrants | Greece
100.0
/100
|
#36
Exceptional
$51,891
Estonians
100.0
/100
|
#37
Exceptional
$51,875
Immigrants | Czechoslovakia
100.0
/100
|
#38
Exceptional
$51,770
Cambodians
100.0
/100
|
#39
Exceptional
$51,731
Immigrants | Korea
100.0
/100
|
#40
Exceptional
$51,671
Immigrants | South Africa
100.0
/100
|
#41
Exceptional
$51,465