Slovak vs Shoshone Householder Income Under 25 years
COMPARE
Slovak
Shoshone
Householder Income Under 25 years
Householder Income Under 25 years Comparison
Slovaks
Shoshone
$49,753
HOUSEHOLDER INCOME UNDER 25 YEARS
0.3/ 100
METRIC RATING
273rd/ 347
METRIC RANK
$48,720
HOUSEHOLDER INCOME UNDER 25 YEARS
0.0/ 100
METRIC RATING
292nd/ 347
METRIC RANK
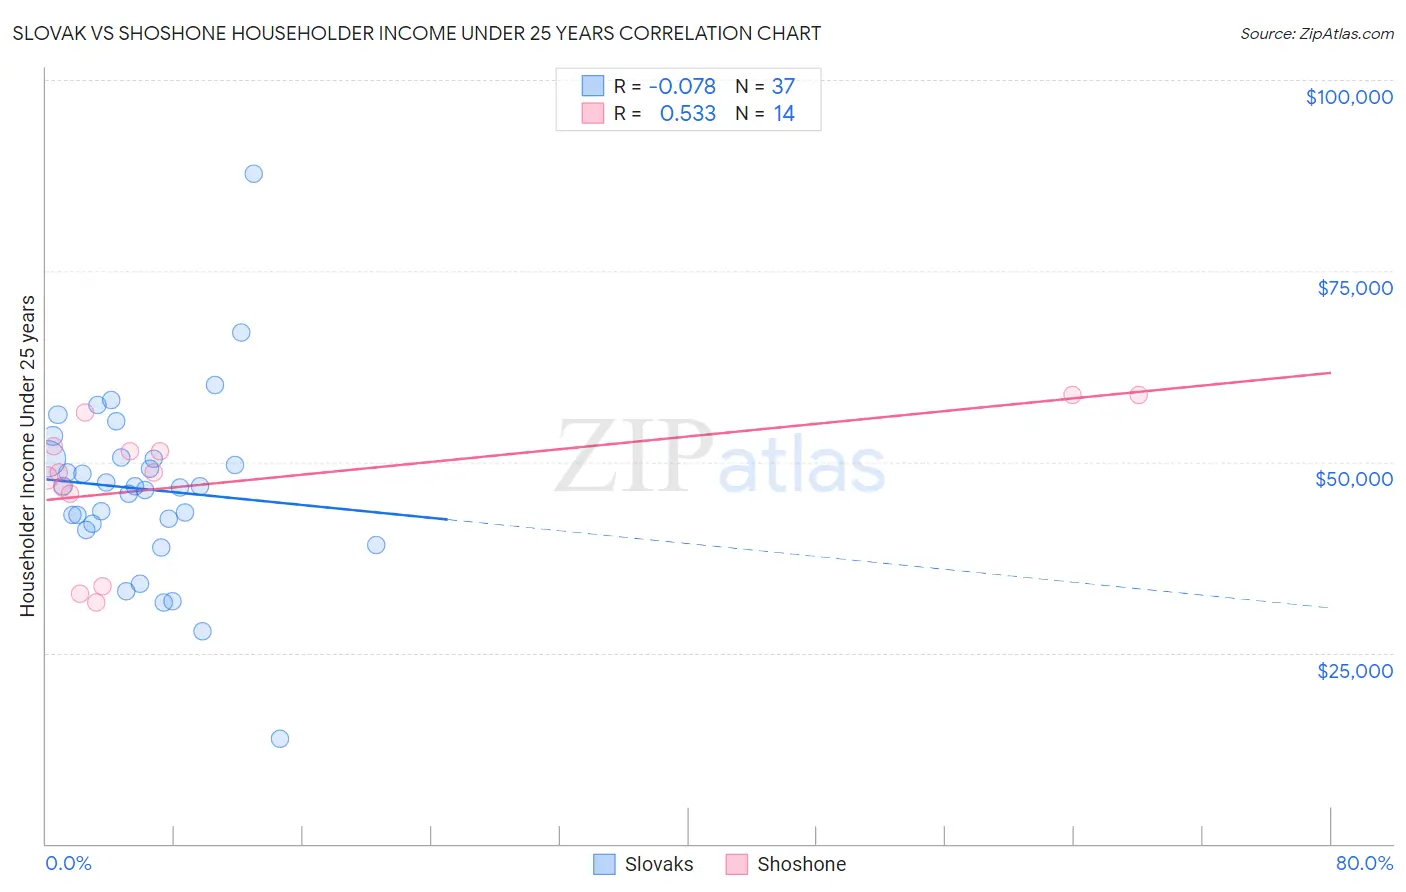
Slovak vs Shoshone Householder Income Under 25 years Correlation Chart
The statistical analysis conducted on geographies consisting of 328,630,657 people shows a slight negative correlation between the proportion of Slovaks and household income with householder under the age of 25 in the United States with a correlation coefficient (R) of -0.078 and weighted average of $49,753. Similarly, the statistical analysis conducted on geographies consisting of 63,873,946 people shows a substantial positive correlation between the proportion of Shoshone and household income with householder under the age of 25 in the United States with a correlation coefficient (R) of 0.533 and weighted average of $48,720, a difference of 2.1%.
Householder Income Under 25 years Correlation Summary
| Measurement | Slovak | Shoshone |
| Minimum | $13,750 | $31,607 |
| Maximum | $87,793 | $58,750 |
| Range | $74,043 | $27,143 |
| Mean | $46,421 | $47,477 |
| Median | $46,765 | $48,627 |
| Interquartile 25% (IQ1) | $41,531 | $45,864 |
| Interquartile 75% (IQ3) | $50,443 | $52,070 |
| Interquartile Range (IQR) | $8,912 | $6,206 |
| Standard Deviation (Sample) | $12,103 | $9,004 |
| Standard Deviation (Population) | $11,938 | $8,676 |
Demographics Similar to Slovaks and Shoshone by Householder Income Under 25 years
In terms of householder income under 25 years, the demographic groups most similar to Slovaks are Immigrants from Senegal ($49,742, a difference of 0.020%), Colville ($49,774, a difference of 0.040%), Immigrants from Kenya ($49,633, a difference of 0.24%), Dominican ($49,633, a difference of 0.24%), and Immigrants from Western Africa ($49,621, a difference of 0.27%). Similarly, the demographic groups most similar to Shoshone are Immigrants from Burma/Myanmar ($48,749, a difference of 0.060%), American ($48,860, a difference of 0.29%), Honduran ($48,885, a difference of 0.34%), Liberian ($48,917, a difference of 0.40%), and Senegalese ($48,953, a difference of 0.48%).
| Demographics | Rating | Rank | Householder Income Under 25 years |
| Colville | 0.3 /100 | #272 | Tragic $49,774 |
| Slovaks | 0.3 /100 | #273 | Tragic $49,753 |
| Immigrants | Senegal | 0.3 /100 | #274 | Tragic $49,742 |
| Immigrants | Kenya | 0.2 /100 | #275 | Tragic $49,633 |
| Dominicans | 0.2 /100 | #276 | Tragic $49,633 |
| Immigrants | Western Africa | 0.2 /100 | #277 | Tragic $49,621 |
| Nigerians | 0.1 /100 | #278 | Tragic $49,416 |
| Apache | 0.1 /100 | #279 | Tragic $49,395 |
| Hmong | 0.1 /100 | #280 | Tragic $49,364 |
| Immigrants | Nonimmigrants | 0.1 /100 | #281 | Tragic $49,348 |
| Alsatians | 0.1 /100 | #282 | Tragic $49,267 |
| Immigrants | Nigeria | 0.1 /100 | #283 | Tragic $49,174 |
| Carpatho Rusyns | 0.1 /100 | #284 | Tragic $49,113 |
| Scotch-Irish | 0.0 /100 | #285 | Tragic $49,039 |
| French American Indians | 0.0 /100 | #286 | Tragic $48,977 |
| Senegalese | 0.0 /100 | #287 | Tragic $48,953 |
| Liberians | 0.0 /100 | #288 | Tragic $48,917 |
| Hondurans | 0.0 /100 | #289 | Tragic $48,885 |
| Americans | 0.0 /100 | #290 | Tragic $48,860 |
| Immigrants | Burma/Myanmar | 0.0 /100 | #291 | Tragic $48,749 |
| Shoshone | 0.0 /100 | #292 | Tragic $48,720 |