Slovak vs Bangladeshi Median Household Income
COMPARE
Slovak
Bangladeshi
Median Household Income
Median Household Income Comparison
Slovaks
Bangladeshis
$83,798
MEDIAN HOUSEHOLD INCOME
30.2/ 100
METRIC RATING
190th/ 347
METRIC RANK
$74,112
MEDIAN HOUSEHOLD INCOME
0.1/ 100
METRIC RATING
290th/ 347
METRIC RANK
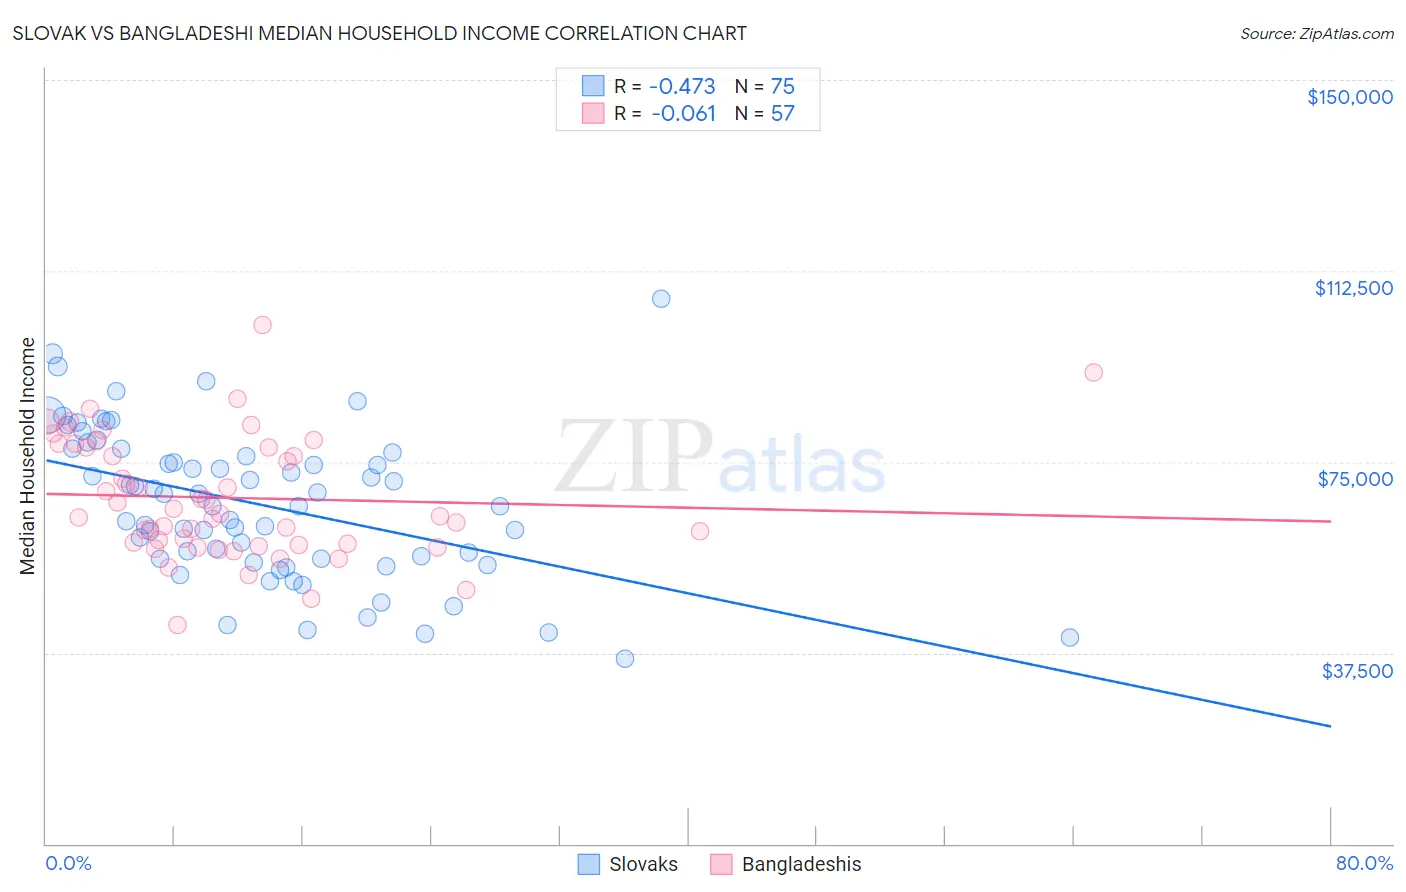
Slovak vs Bangladeshi Median Household Income Correlation Chart
The statistical analysis conducted on geographies consisting of 397,588,666 people shows a moderate negative correlation between the proportion of Slovaks and median household income in the United States with a correlation coefficient (R) of -0.473 and weighted average of $83,798. Similarly, the statistical analysis conducted on geographies consisting of 141,320,446 people shows a slight negative correlation between the proportion of Bangladeshis and median household income in the United States with a correlation coefficient (R) of -0.061 and weighted average of $74,112, a difference of 13.1%.
Median Household Income Correlation Summary
| Measurement | Slovak | Bangladeshi |
| Minimum | $36,453 | $42,858 |
| Maximum | $106,990 | $101,820 |
| Range | $70,537 | $58,962 |
| Mean | $66,640 | $67,935 |
| Median | $66,359 | $64,799 |
| Interquartile 25% (IQ1) | $55,938 | $58,792 |
| Interquartile 75% (IQ3) | $76,771 | $78,284 |
| Interquartile Range (IQR) | $20,833 | $19,492 |
| Standard Deviation (Sample) | $14,677 | $11,839 |
| Standard Deviation (Population) | $14,579 | $11,735 |
Similar Demographics by Median Household Income
Demographics Similar to Slovaks by Median Household Income
In terms of median household income, the demographic groups most similar to Slovaks are Iraqi ($83,753, a difference of 0.050%), Immigrants from Colombia ($83,902, a difference of 0.12%), Tlingit-Haida ($83,968, a difference of 0.20%), Welsh ($83,628, a difference of 0.20%), and Finnish ($83,607, a difference of 0.23%).
| Demographics | Rating | Rank | Median Household Income |
| Spaniards | 42.7 /100 | #183 | Average $84,644 |
| Immigrants | Eastern Africa | 37.4 /100 | #184 | Fair $84,299 |
| Kenyans | 34.2 /100 | #185 | Fair $84,085 |
| Puget Sound Salish | 33.2 /100 | #186 | Fair $84,011 |
| Belgians | 33.2 /100 | #187 | Fair $84,008 |
| Tlingit-Haida | 32.6 /100 | #188 | Fair $83,968 |
| Immigrants | Colombia | 31.7 /100 | #189 | Fair $83,902 |
| Slovaks | 30.2 /100 | #190 | Fair $83,798 |
| Iraqis | 29.6 /100 | #191 | Fair $83,753 |
| Welsh | 28.0 /100 | #192 | Fair $83,628 |
| Finns | 27.7 /100 | #193 | Fair $83,607 |
| Ghanaians | 27.4 /100 | #194 | Fair $83,582 |
| Immigrants | Armenia | 27.0 /100 | #195 | Fair $83,555 |
| French | 26.0 /100 | #196 | Fair $83,468 |
| Aleuts | 25.7 /100 | #197 | Fair $83,446 |
Demographics Similar to Bangladeshis by Median Household Income
In terms of median household income, the demographic groups most similar to Bangladeshis are Fijian ($74,205, a difference of 0.13%), Immigrants from Central America ($74,217, a difference of 0.14%), Iroquois ($74,279, a difference of 0.23%), Immigrants from Somalia ($74,300, a difference of 0.25%), and Mexican ($74,399, a difference of 0.39%).
| Demographics | Rating | Rank | Median Household Income |
| Cree | 0.1 /100 | #283 | Tragic $74,685 |
| Yaqui | 0.1 /100 | #284 | Tragic $74,596 |
| Mexicans | 0.1 /100 | #285 | Tragic $74,399 |
| Immigrants | Somalia | 0.1 /100 | #286 | Tragic $74,300 |
| Iroquois | 0.1 /100 | #287 | Tragic $74,279 |
| Immigrants | Central America | 0.1 /100 | #288 | Tragic $74,217 |
| Fijians | 0.1 /100 | #289 | Tragic $74,205 |
| Bangladeshis | 0.1 /100 | #290 | Tragic $74,112 |
| Hispanics or Latinos | 0.1 /100 | #291 | Tragic $73,823 |
| Comanche | 0.1 /100 | #292 | Tragic $73,747 |
| Immigrants | Cabo Verde | 0.1 /100 | #293 | Tragic $73,515 |
| Blackfeet | 0.1 /100 | #294 | Tragic $73,509 |
| Cubans | 0.1 /100 | #295 | Tragic $73,392 |
| Haitians | 0.1 /100 | #296 | Tragic $73,306 |
| Immigrants | Mexico | 0.0 /100 | #297 | Tragic $73,160 |