Pueblo vs Bangladeshi Median Household Income
COMPARE
Pueblo
Bangladeshi
Median Household Income
Median Household Income Comparison
Pueblo
Bangladeshis
$64,692
MEDIAN HOUSEHOLD INCOME
0.0/ 100
METRIC RATING
340th/ 347
METRIC RANK
$74,112
MEDIAN HOUSEHOLD INCOME
0.1/ 100
METRIC RATING
290th/ 347
METRIC RANK
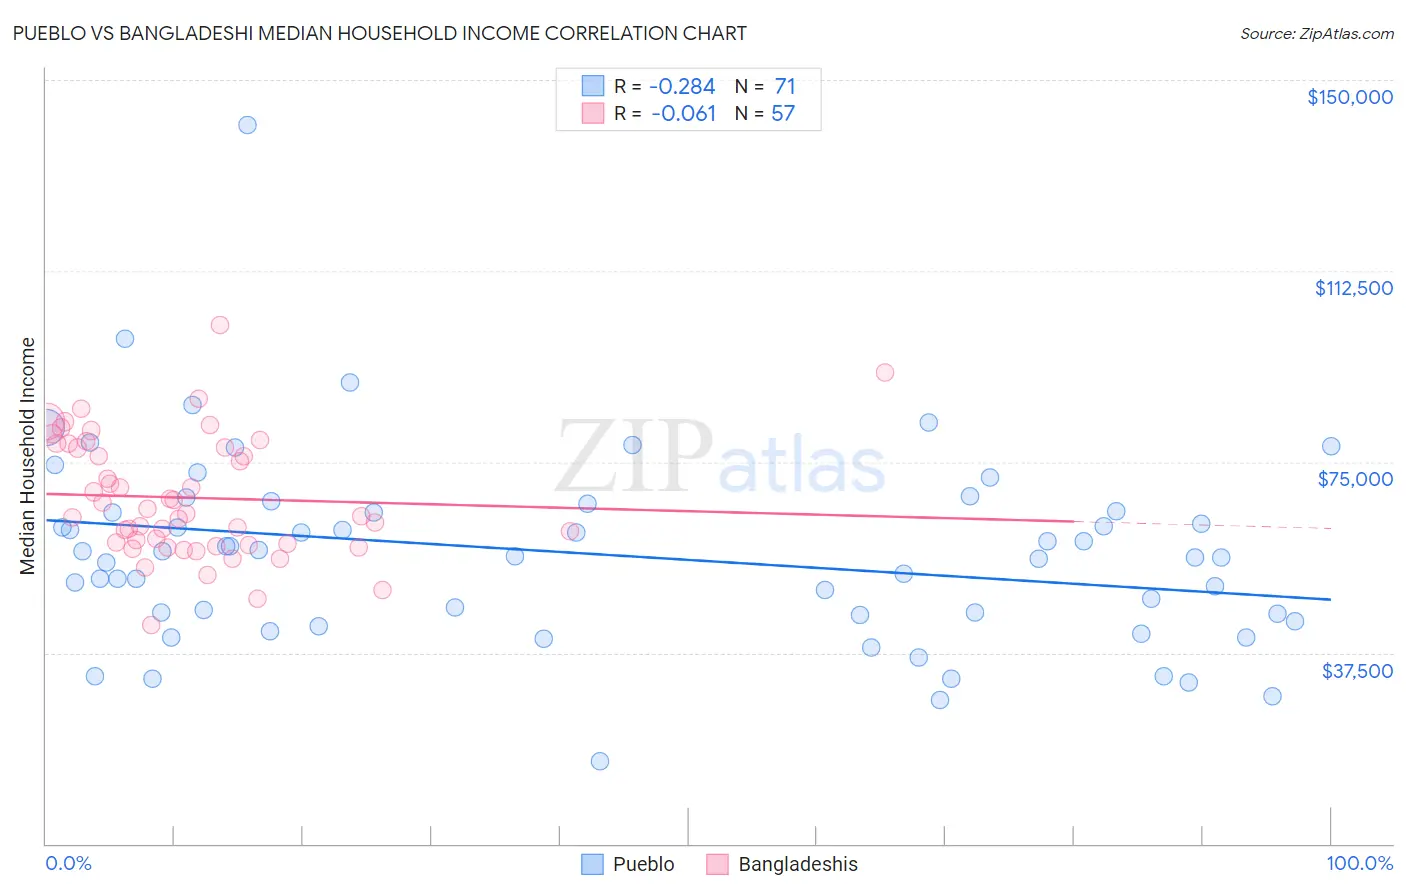
Pueblo vs Bangladeshi Median Household Income Correlation Chart
The statistical analysis conducted on geographies consisting of 120,058,820 people shows a weak negative correlation between the proportion of Pueblo and median household income in the United States with a correlation coefficient (R) of -0.284 and weighted average of $64,692. Similarly, the statistical analysis conducted on geographies consisting of 141,320,446 people shows a slight negative correlation between the proportion of Bangladeshis and median household income in the United States with a correlation coefficient (R) of -0.061 and weighted average of $74,112, a difference of 14.6%.
Median Household Income Correlation Summary
| Measurement | Pueblo | Bangladeshi |
| Minimum | $16,250 | $42,858 |
| Maximum | $141,139 | $101,820 |
| Range | $124,889 | $58,962 |
| Mean | $56,992 | $67,935 |
| Median | $56,397 | $64,799 |
| Interquartile 25% (IQ1) | $44,868 | $58,792 |
| Interquartile 75% (IQ3) | $65,216 | $78,284 |
| Interquartile Range (IQR) | $20,348 | $19,492 |
| Standard Deviation (Sample) | $19,041 | $11,839 |
| Standard Deviation (Population) | $18,906 | $11,735 |
Similar Demographics by Median Household Income
Demographics Similar to Pueblo by Median Household Income
In terms of median household income, the demographic groups most similar to Pueblo are Hopi ($65,043, a difference of 0.54%), Immigrants from Yemen ($65,194, a difference of 0.78%), Crow ($63,681, a difference of 1.6%), Kiowa ($65,914, a difference of 1.9%), and Pima ($63,262, a difference of 2.3%).
| Demographics | Rating | Rank | Median Household Income |
| Creek | 0.0 /100 | #333 | Tragic $67,715 |
| Blacks/African Americans | 0.0 /100 | #334 | Tragic $67,573 |
| Cheyenne | 0.0 /100 | #335 | Tragic $66,974 |
| Immigrants | Congo | 0.0 /100 | #336 | Tragic $66,768 |
| Kiowa | 0.0 /100 | #337 | Tragic $65,914 |
| Immigrants | Yemen | 0.0 /100 | #338 | Tragic $65,194 |
| Hopi | 0.0 /100 | #339 | Tragic $65,043 |
| Pueblo | 0.0 /100 | #340 | Tragic $64,692 |
| Crow | 0.0 /100 | #341 | Tragic $63,681 |
| Pima | 0.0 /100 | #342 | Tragic $63,262 |
| Houma | 0.0 /100 | #343 | Tragic $62,575 |
| Tohono O'odham | 0.0 /100 | #344 | Tragic $61,663 |
| Puerto Ricans | 0.0 /100 | #345 | Tragic $59,197 |
| Navajo | 0.0 /100 | #346 | Tragic $59,159 |
| Lumbee | 0.0 /100 | #347 | Tragic $54,644 |
Demographics Similar to Bangladeshis by Median Household Income
In terms of median household income, the demographic groups most similar to Bangladeshis are Fijian ($74,205, a difference of 0.13%), Immigrants from Central America ($74,217, a difference of 0.14%), Iroquois ($74,279, a difference of 0.23%), Immigrants from Somalia ($74,300, a difference of 0.25%), and Mexican ($74,399, a difference of 0.39%).
| Demographics | Rating | Rank | Median Household Income |
| Cree | 0.1 /100 | #283 | Tragic $74,685 |
| Yaqui | 0.1 /100 | #284 | Tragic $74,596 |
| Mexicans | 0.1 /100 | #285 | Tragic $74,399 |
| Immigrants | Somalia | 0.1 /100 | #286 | Tragic $74,300 |
| Iroquois | 0.1 /100 | #287 | Tragic $74,279 |
| Immigrants | Central America | 0.1 /100 | #288 | Tragic $74,217 |
| Fijians | 0.1 /100 | #289 | Tragic $74,205 |
| Bangladeshis | 0.1 /100 | #290 | Tragic $74,112 |
| Hispanics or Latinos | 0.1 /100 | #291 | Tragic $73,823 |
| Comanche | 0.1 /100 | #292 | Tragic $73,747 |
| Immigrants | Cabo Verde | 0.1 /100 | #293 | Tragic $73,515 |
| Blackfeet | 0.1 /100 | #294 | Tragic $73,509 |
| Cubans | 0.1 /100 | #295 | Tragic $73,392 |
| Haitians | 0.1 /100 | #296 | Tragic $73,306 |
| Immigrants | Mexico | 0.0 /100 | #297 | Tragic $73,160 |