Greek vs Bangladeshi Median Household Income
COMPARE
Greek
Bangladeshi
Median Household Income
Median Household Income Comparison
Greeks
Bangladeshis
$94,735
MEDIAN HOUSEHOLD INCOME
99.8/ 100
METRIC RATING
63rd/ 347
METRIC RANK
$74,112
MEDIAN HOUSEHOLD INCOME
0.1/ 100
METRIC RATING
290th/ 347
METRIC RANK
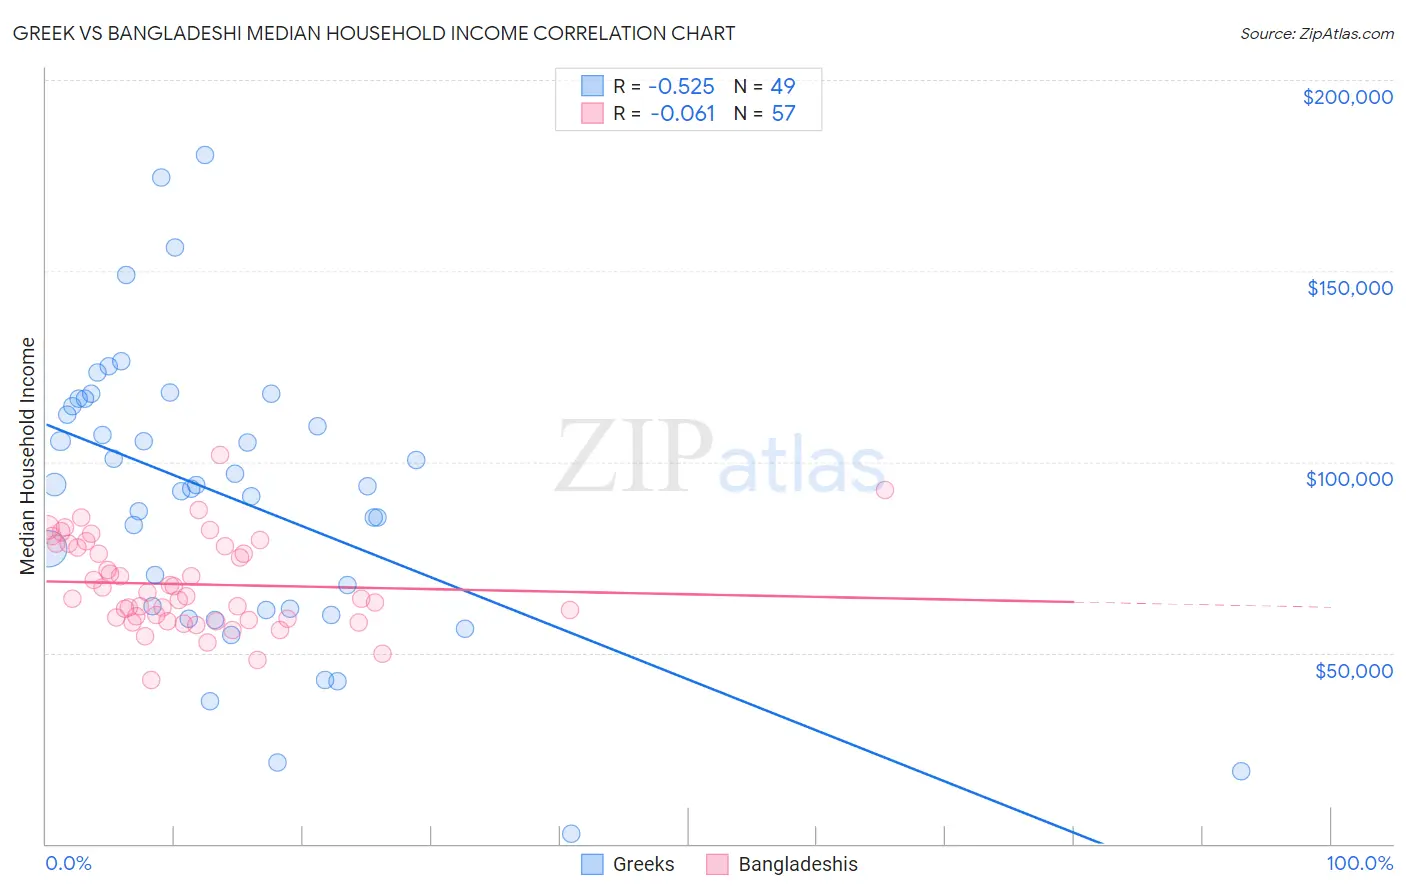
Greek vs Bangladeshi Median Household Income Correlation Chart
The statistical analysis conducted on geographies consisting of 482,222,552 people shows a substantial negative correlation between the proportion of Greeks and median household income in the United States with a correlation coefficient (R) of -0.525 and weighted average of $94,735. Similarly, the statistical analysis conducted on geographies consisting of 141,320,446 people shows a slight negative correlation between the proportion of Bangladeshis and median household income in the United States with a correlation coefficient (R) of -0.061 and weighted average of $74,112, a difference of 27.8%.
Median Household Income Correlation Summary
| Measurement | Greek | Bangladeshi |
| Minimum | $2,499 | $42,858 |
| Maximum | $180,197 | $101,820 |
| Range | $177,698 | $58,962 |
| Mean | $90,436 | $67,935 |
| Median | $93,750 | $64,799 |
| Interquartile 25% (IQ1) | $61,372 | $58,792 |
| Interquartile 75% (IQ3) | $115,471 | $78,284 |
| Interquartile Range (IQR) | $54,098 | $19,492 |
| Standard Deviation (Sample) | $37,295 | $11,839 |
| Standard Deviation (Population) | $36,913 | $11,735 |
Similar Demographics by Median Household Income
Demographics Similar to Greeks by Median Household Income
In terms of median household income, the demographic groups most similar to Greeks are Immigrants from Norway ($94,846, a difference of 0.12%), Laotian ($94,990, a difference of 0.27%), Korean ($95,018, a difference of 0.30%), Immigrants from Europe ($95,032, a difference of 0.31%), and Immigrants from Netherlands ($94,411, a difference of 0.34%).
| Demographics | Rating | Rank | Median Household Income |
| Immigrants | Austria | 99.9 /100 | #56 | Exceptional $95,277 |
| New Zealanders | 99.8 /100 | #57 | Exceptional $95,146 |
| Soviet Union | 99.8 /100 | #58 | Exceptional $95,098 |
| Immigrants | Europe | 99.8 /100 | #59 | Exceptional $95,032 |
| Koreans | 99.8 /100 | #60 | Exceptional $95,018 |
| Laotians | 99.8 /100 | #61 | Exceptional $94,990 |
| Immigrants | Norway | 99.8 /100 | #62 | Exceptional $94,846 |
| Greeks | 99.8 /100 | #63 | Exceptional $94,735 |
| Immigrants | Netherlands | 99.7 /100 | #64 | Exceptional $94,411 |
| Immigrants | Belarus | 99.7 /100 | #65 | Exceptional $94,399 |
| Immigrants | Romania | 99.7 /100 | #66 | Exceptional $94,222 |
| Immigrants | Scotland | 99.7 /100 | #67 | Exceptional $94,091 |
| Mongolians | 99.7 /100 | #68 | Exceptional $93,971 |
| Argentineans | 99.7 /100 | #69 | Exceptional $93,960 |
| Immigrants | Fiji | 99.7 /100 | #70 | Exceptional $93,933 |
Demographics Similar to Bangladeshis by Median Household Income
In terms of median household income, the demographic groups most similar to Bangladeshis are Fijian ($74,205, a difference of 0.13%), Immigrants from Central America ($74,217, a difference of 0.14%), Iroquois ($74,279, a difference of 0.23%), Immigrants from Somalia ($74,300, a difference of 0.25%), and Mexican ($74,399, a difference of 0.39%).
| Demographics | Rating | Rank | Median Household Income |
| Cree | 0.1 /100 | #283 | Tragic $74,685 |
| Yaqui | 0.1 /100 | #284 | Tragic $74,596 |
| Mexicans | 0.1 /100 | #285 | Tragic $74,399 |
| Immigrants | Somalia | 0.1 /100 | #286 | Tragic $74,300 |
| Iroquois | 0.1 /100 | #287 | Tragic $74,279 |
| Immigrants | Central America | 0.1 /100 | #288 | Tragic $74,217 |
| Fijians | 0.1 /100 | #289 | Tragic $74,205 |
| Bangladeshis | 0.1 /100 | #290 | Tragic $74,112 |
| Hispanics or Latinos | 0.1 /100 | #291 | Tragic $73,823 |
| Comanche | 0.1 /100 | #292 | Tragic $73,747 |
| Immigrants | Cabo Verde | 0.1 /100 | #293 | Tragic $73,515 |
| Blackfeet | 0.1 /100 | #294 | Tragic $73,509 |
| Cubans | 0.1 /100 | #295 | Tragic $73,392 |
| Haitians | 0.1 /100 | #296 | Tragic $73,306 |
| Immigrants | Mexico | 0.0 /100 | #297 | Tragic $73,160 |