Immigrants from Thailand vs Bangladeshi Median Household Income
COMPARE
Immigrants from Thailand
Bangladeshi
Median Household Income
Median Household Income Comparison
Immigrants from Thailand
Bangladeshis
$83,327
MEDIAN HOUSEHOLD INCOME
24.3/ 100
METRIC RATING
202nd/ 347
METRIC RANK
$74,112
MEDIAN HOUSEHOLD INCOME
0.1/ 100
METRIC RATING
290th/ 347
METRIC RANK
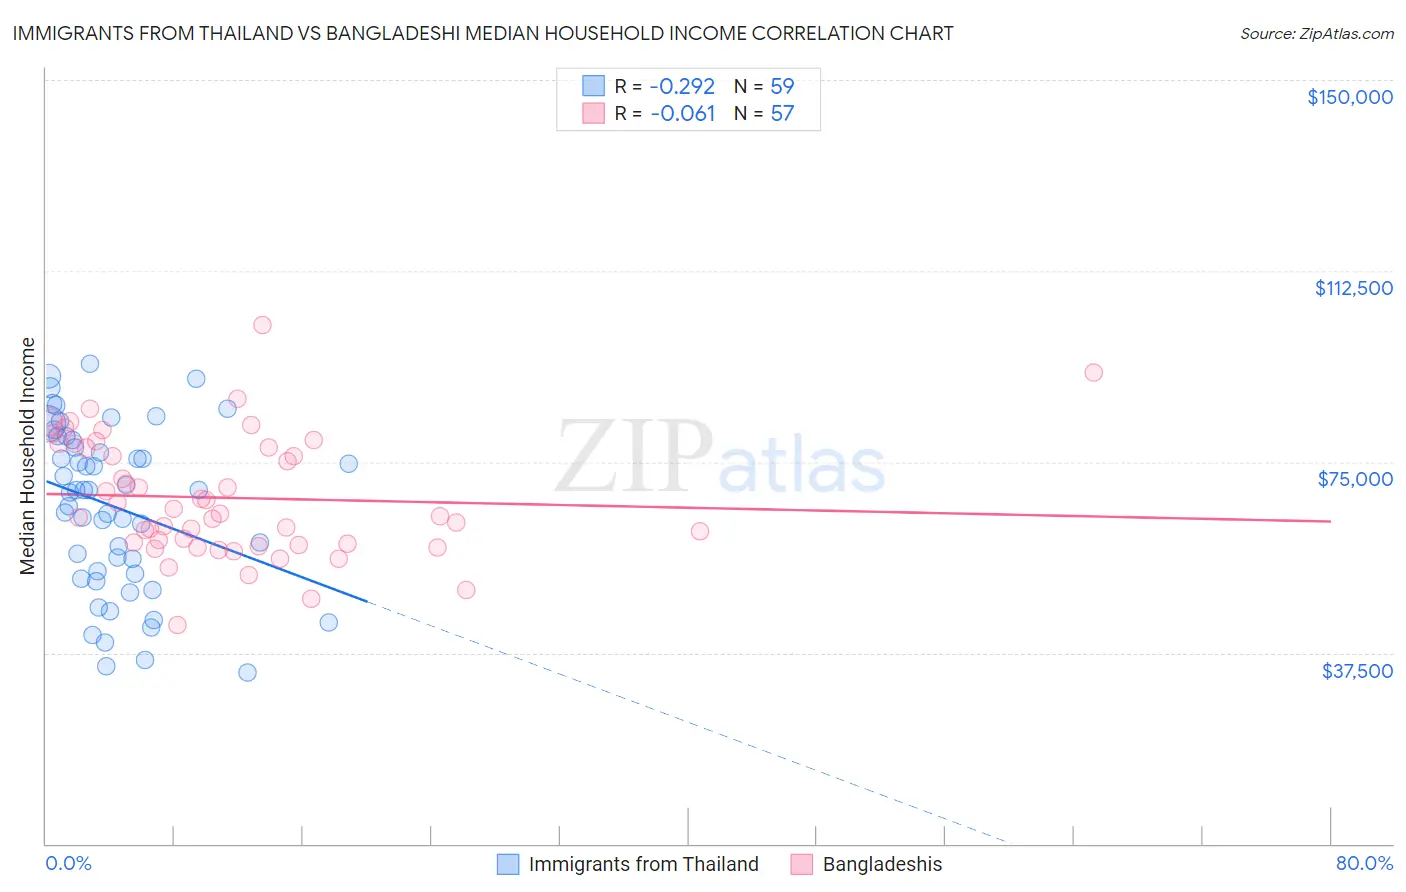
Immigrants from Thailand vs Bangladeshi Median Household Income Correlation Chart
The statistical analysis conducted on geographies consisting of 316,905,677 people shows a weak negative correlation between the proportion of Immigrants from Thailand and median household income in the United States with a correlation coefficient (R) of -0.292 and weighted average of $83,327. Similarly, the statistical analysis conducted on geographies consisting of 141,320,446 people shows a slight negative correlation between the proportion of Bangladeshis and median household income in the United States with a correlation coefficient (R) of -0.061 and weighted average of $74,112, a difference of 12.4%.
Median Household Income Correlation Summary
| Measurement | Immigrants from Thailand | Bangladeshi |
| Minimum | $33,750 | $42,858 |
| Maximum | $94,169 | $101,820 |
| Range | $60,419 | $58,962 |
| Mean | $66,115 | $67,935 |
| Median | $69,375 | $64,799 |
| Interquartile 25% (IQ1) | $53,069 | $58,792 |
| Interquartile 75% (IQ3) | $79,311 | $78,284 |
| Interquartile Range (IQR) | $26,242 | $19,492 |
| Standard Deviation (Sample) | $16,097 | $11,839 |
| Standard Deviation (Population) | $15,960 | $11,735 |
Similar Demographics by Median Household Income
Demographics Similar to Immigrants from Thailand by Median Household Income
In terms of median household income, the demographic groups most similar to Immigrants from Thailand are Tsimshian ($83,346, a difference of 0.020%), Spanish ($83,343, a difference of 0.020%), Immigrants from Cambodia ($83,304, a difference of 0.030%), German ($83,358, a difference of 0.040%), and Immigrants from Africa ($83,289, a difference of 0.050%).
| Demographics | Rating | Rank | Median Household Income |
| Immigrants | Armenia | 27.0 /100 | #195 | Fair $83,555 |
| French | 26.0 /100 | #196 | Fair $83,468 |
| Aleuts | 25.7 /100 | #197 | Fair $83,446 |
| Japanese | 25.1 /100 | #198 | Fair $83,395 |
| Germans | 24.6 /100 | #199 | Fair $83,358 |
| Tsimshian | 24.5 /100 | #200 | Fair $83,346 |
| Spanish | 24.4 /100 | #201 | Fair $83,343 |
| Immigrants | Thailand | 24.3 /100 | #202 | Fair $83,327 |
| Immigrants | Cambodia | 24.0 /100 | #203 | Fair $83,304 |
| Immigrants | Africa | 23.8 /100 | #204 | Fair $83,289 |
| Celtics | 22.7 /100 | #205 | Fair $83,193 |
| Immigrants | Kenya | 21.3 /100 | #206 | Fair $83,068 |
| Dutch | 20.3 /100 | #207 | Fair $82,971 |
| French Canadians | 18.7 /100 | #208 | Poor $82,810 |
| Immigrants | Iraq | 16.7 /100 | #209 | Poor $82,594 |
Demographics Similar to Bangladeshis by Median Household Income
In terms of median household income, the demographic groups most similar to Bangladeshis are Fijian ($74,205, a difference of 0.13%), Immigrants from Central America ($74,217, a difference of 0.14%), Iroquois ($74,279, a difference of 0.23%), Immigrants from Somalia ($74,300, a difference of 0.25%), and Mexican ($74,399, a difference of 0.39%).
| Demographics | Rating | Rank | Median Household Income |
| Cree | 0.1 /100 | #283 | Tragic $74,685 |
| Yaqui | 0.1 /100 | #284 | Tragic $74,596 |
| Mexicans | 0.1 /100 | #285 | Tragic $74,399 |
| Immigrants | Somalia | 0.1 /100 | #286 | Tragic $74,300 |
| Iroquois | 0.1 /100 | #287 | Tragic $74,279 |
| Immigrants | Central America | 0.1 /100 | #288 | Tragic $74,217 |
| Fijians | 0.1 /100 | #289 | Tragic $74,205 |
| Bangladeshis | 0.1 /100 | #290 | Tragic $74,112 |
| Hispanics or Latinos | 0.1 /100 | #291 | Tragic $73,823 |
| Comanche | 0.1 /100 | #292 | Tragic $73,747 |
| Immigrants | Cabo Verde | 0.1 /100 | #293 | Tragic $73,515 |
| Blackfeet | 0.1 /100 | #294 | Tragic $73,509 |
| Cubans | 0.1 /100 | #295 | Tragic $73,392 |
| Haitians | 0.1 /100 | #296 | Tragic $73,306 |
| Immigrants | Mexico | 0.0 /100 | #297 | Tragic $73,160 |