Slovak vs Taiwanese Median Household Income
COMPARE
Slovak
Taiwanese
Median Household Income
Median Household Income Comparison
Slovaks
Taiwanese
$83,798
MEDIAN HOUSEHOLD INCOME
30.2/ 100
METRIC RATING
190th/ 347
METRIC RANK
$89,900
MEDIAN HOUSEHOLD INCOME
95.6/ 100
METRIC RATING
117th/ 347
METRIC RANK
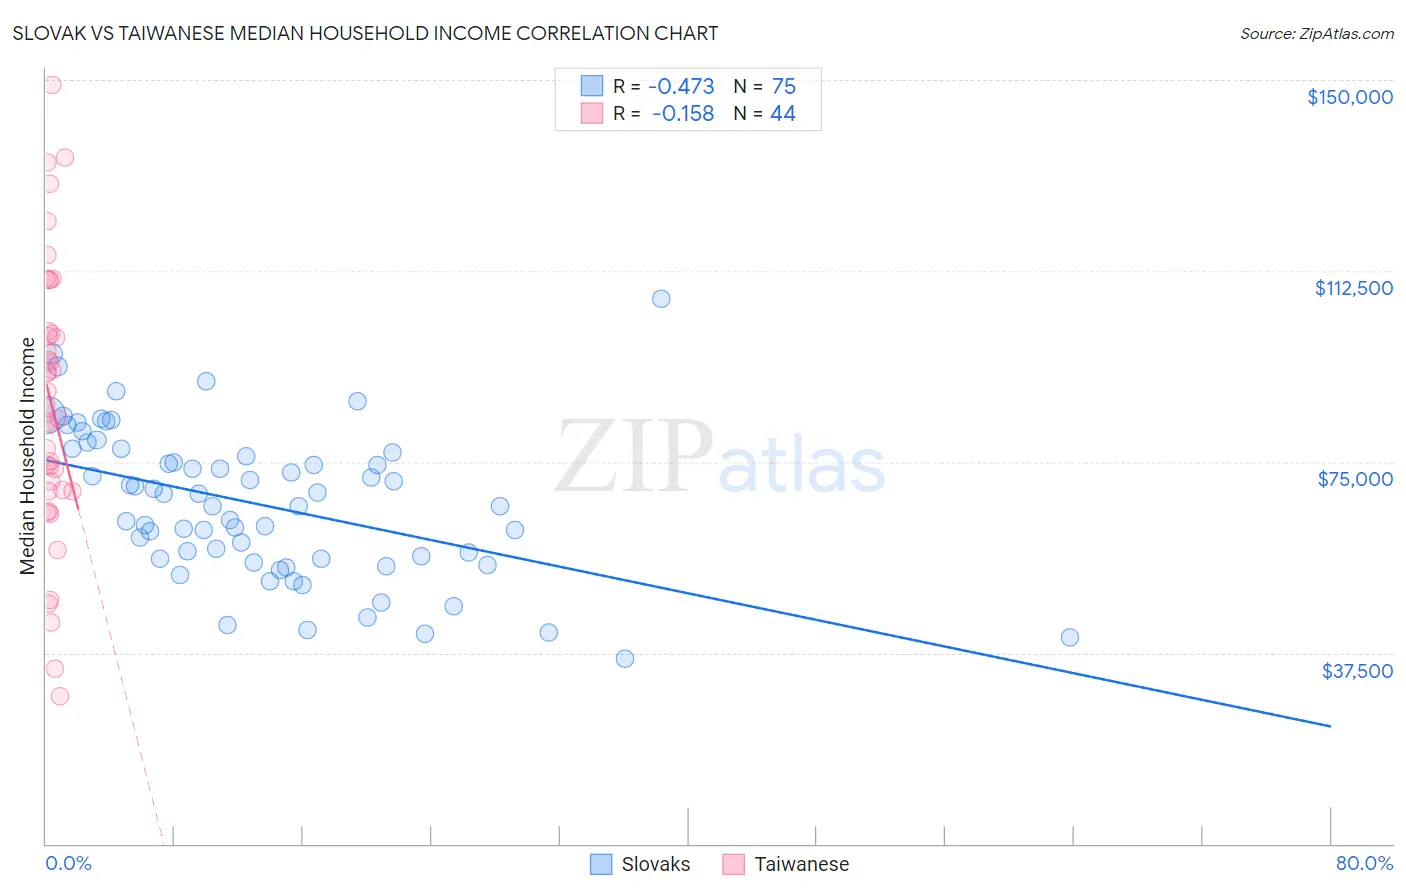
Slovak vs Taiwanese Median Household Income Correlation Chart
The statistical analysis conducted on geographies consisting of 397,588,666 people shows a moderate negative correlation between the proportion of Slovaks and median household income in the United States with a correlation coefficient (R) of -0.473 and weighted average of $83,798. Similarly, the statistical analysis conducted on geographies consisting of 31,709,765 people shows a poor negative correlation between the proportion of Taiwanese and median household income in the United States with a correlation coefficient (R) of -0.158 and weighted average of $89,900, a difference of 7.3%.
Median Household Income Correlation Summary
| Measurement | Slovak | Taiwanese |
| Minimum | $36,453 | $29,038 |
| Maximum | $106,990 | $149,028 |
| Range | $70,537 | $119,990 |
| Mean | $66,640 | $86,573 |
| Median | $66,359 | $85,327 |
| Interquartile 25% (IQ1) | $55,938 | $69,445 |
| Interquartile 75% (IQ3) | $76,771 | $100,383 |
| Interquartile Range (IQR) | $20,833 | $30,938 |
| Standard Deviation (Sample) | $14,677 | $26,800 |
| Standard Deviation (Population) | $14,579 | $26,494 |
Similar Demographics by Median Household Income
Demographics Similar to Slovaks by Median Household Income
In terms of median household income, the demographic groups most similar to Slovaks are Iraqi ($83,753, a difference of 0.050%), Immigrants from Colombia ($83,902, a difference of 0.12%), Tlingit-Haida ($83,968, a difference of 0.20%), Welsh ($83,628, a difference of 0.20%), and Finnish ($83,607, a difference of 0.23%).
| Demographics | Rating | Rank | Median Household Income |
| Spaniards | 42.7 /100 | #183 | Average $84,644 |
| Immigrants | Eastern Africa | 37.4 /100 | #184 | Fair $84,299 |
| Kenyans | 34.2 /100 | #185 | Fair $84,085 |
| Puget Sound Salish | 33.2 /100 | #186 | Fair $84,011 |
| Belgians | 33.2 /100 | #187 | Fair $84,008 |
| Tlingit-Haida | 32.6 /100 | #188 | Fair $83,968 |
| Immigrants | Colombia | 31.7 /100 | #189 | Fair $83,902 |
| Slovaks | 30.2 /100 | #190 | Fair $83,798 |
| Iraqis | 29.6 /100 | #191 | Fair $83,753 |
| Welsh | 28.0 /100 | #192 | Fair $83,628 |
| Finns | 27.7 /100 | #193 | Fair $83,607 |
| Ghanaians | 27.4 /100 | #194 | Fair $83,582 |
| Immigrants | Armenia | 27.0 /100 | #195 | Fair $83,555 |
| French | 26.0 /100 | #196 | Fair $83,468 |
| Aleuts | 25.7 /100 | #197 | Fair $83,446 |
Demographics Similar to Taiwanese by Median Household Income
In terms of median household income, the demographic groups most similar to Taiwanese are Native Hawaiian ($89,919, a difference of 0.020%), Syrian ($89,830, a difference of 0.080%), Immigrants from Western Asia ($90,005, a difference of 0.12%), Immigrants from Northern Africa ($90,026, a difference of 0.14%), and Albanian ($89,744, a difference of 0.17%).
| Demographics | Rating | Rank | Median Household Income |
| Palestinians | 97.1 /100 | #110 | Exceptional $90,574 |
| Immigrants | Poland | 97.1 /100 | #111 | Exceptional $90,549 |
| Northern Europeans | 96.9 /100 | #112 | Exceptional $90,446 |
| Peruvians | 96.5 /100 | #113 | Exceptional $90,261 |
| Immigrants | Northern Africa | 95.9 /100 | #114 | Exceptional $90,026 |
| Immigrants | Western Asia | 95.9 /100 | #115 | Exceptional $90,005 |
| Native Hawaiians | 95.7 /100 | #116 | Exceptional $89,919 |
| Taiwanese | 95.6 /100 | #117 | Exceptional $89,900 |
| Syrians | 95.4 /100 | #118 | Exceptional $89,830 |
| Albanians | 95.2 /100 | #119 | Exceptional $89,744 |
| Immigrants | North Macedonia | 95.2 /100 | #120 | Exceptional $89,741 |
| Ethiopians | 94.9 /100 | #121 | Exceptional $89,640 |
| Pakistanis | 94.8 /100 | #122 | Exceptional $89,638 |
| Immigrants | Zimbabwe | 94.4 /100 | #123 | Exceptional $89,496 |
| Immigrants | Jordan | 94.1 /100 | #124 | Exceptional $89,412 |