Puget Sound Salish vs Bangladeshi Median Household Income
COMPARE
Puget Sound Salish
Bangladeshi
Median Household Income
Median Household Income Comparison
Puget Sound Salish
Bangladeshis
$84,011
MEDIAN HOUSEHOLD INCOME
33.2/ 100
METRIC RATING
186th/ 347
METRIC RANK
$74,112
MEDIAN HOUSEHOLD INCOME
0.1/ 100
METRIC RATING
290th/ 347
METRIC RANK
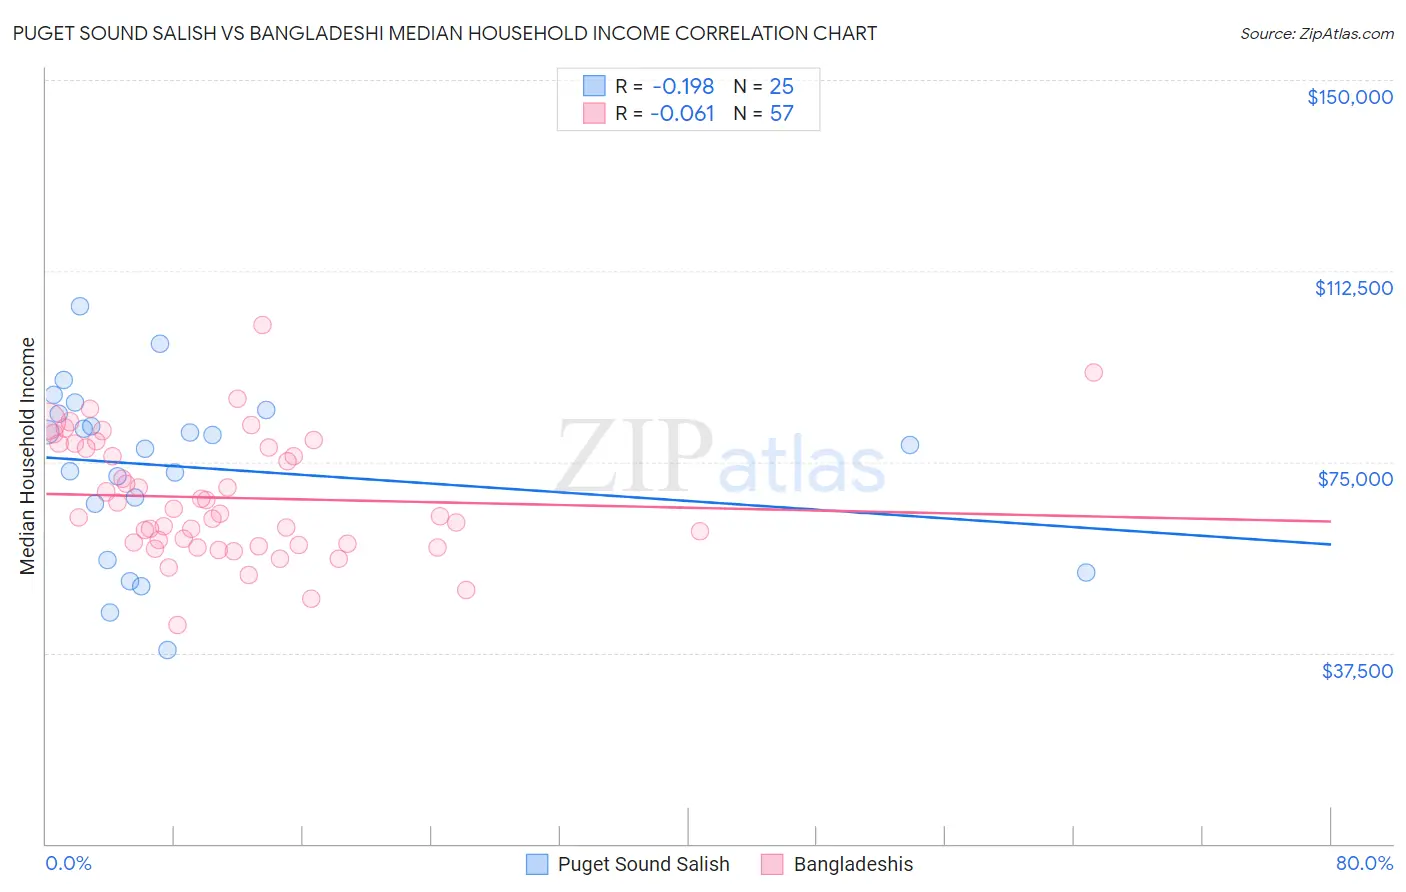
Puget Sound Salish vs Bangladeshi Median Household Income Correlation Chart
The statistical analysis conducted on geographies consisting of 46,152,941 people shows a poor negative correlation between the proportion of Puget Sound Salish and median household income in the United States with a correlation coefficient (R) of -0.198 and weighted average of $84,011. Similarly, the statistical analysis conducted on geographies consisting of 141,320,446 people shows a slight negative correlation between the proportion of Bangladeshis and median household income in the United States with a correlation coefficient (R) of -0.061 and weighted average of $74,112, a difference of 13.4%.
Median Household Income Correlation Summary
| Measurement | Puget Sound Salish | Bangladeshi |
| Minimum | $37,964 | $42,858 |
| Maximum | $105,684 | $101,820 |
| Range | $67,720 | $58,962 |
| Mean | $73,927 | $67,935 |
| Median | $78,333 | $64,799 |
| Interquartile 25% (IQ1) | $61,302 | $58,792 |
| Interquartile 75% (IQ3) | $84,790 | $78,284 |
| Interquartile Range (IQR) | $23,488 | $19,492 |
| Standard Deviation (Sample) | $16,803 | $11,839 |
| Standard Deviation (Population) | $16,464 | $11,735 |
Similar Demographics by Median Household Income
Demographics Similar to Puget Sound Salish by Median Household Income
In terms of median household income, the demographic groups most similar to Puget Sound Salish are Belgian ($84,008, a difference of 0.0%), Tlingit-Haida ($83,968, a difference of 0.050%), Kenyan ($84,085, a difference of 0.090%), Immigrants from Colombia ($83,902, a difference of 0.13%), and Slovak ($83,798, a difference of 0.25%).
| Demographics | Rating | Rank | Median Household Income |
| English | 47.0 /100 | #179 | Average $84,915 |
| Immigrants | Portugal | 44.2 /100 | #180 | Average $84,740 |
| Hawaiians | 44.1 /100 | #181 | Average $84,729 |
| Uruguayans | 43.5 /100 | #182 | Average $84,691 |
| Spaniards | 42.7 /100 | #183 | Average $84,644 |
| Immigrants | Eastern Africa | 37.4 /100 | #184 | Fair $84,299 |
| Kenyans | 34.2 /100 | #185 | Fair $84,085 |
| Puget Sound Salish | 33.2 /100 | #186 | Fair $84,011 |
| Belgians | 33.2 /100 | #187 | Fair $84,008 |
| Tlingit-Haida | 32.6 /100 | #188 | Fair $83,968 |
| Immigrants | Colombia | 31.7 /100 | #189 | Fair $83,902 |
| Slovaks | 30.2 /100 | #190 | Fair $83,798 |
| Iraqis | 29.6 /100 | #191 | Fair $83,753 |
| Welsh | 28.0 /100 | #192 | Fair $83,628 |
| Finns | 27.7 /100 | #193 | Fair $83,607 |
Demographics Similar to Bangladeshis by Median Household Income
In terms of median household income, the demographic groups most similar to Bangladeshis are Fijian ($74,205, a difference of 0.13%), Immigrants from Central America ($74,217, a difference of 0.14%), Iroquois ($74,279, a difference of 0.23%), Immigrants from Somalia ($74,300, a difference of 0.25%), and Mexican ($74,399, a difference of 0.39%).
| Demographics | Rating | Rank | Median Household Income |
| Cree | 0.1 /100 | #283 | Tragic $74,685 |
| Yaqui | 0.1 /100 | #284 | Tragic $74,596 |
| Mexicans | 0.1 /100 | #285 | Tragic $74,399 |
| Immigrants | Somalia | 0.1 /100 | #286 | Tragic $74,300 |
| Iroquois | 0.1 /100 | #287 | Tragic $74,279 |
| Immigrants | Central America | 0.1 /100 | #288 | Tragic $74,217 |
| Fijians | 0.1 /100 | #289 | Tragic $74,205 |
| Bangladeshis | 0.1 /100 | #290 | Tragic $74,112 |
| Hispanics or Latinos | 0.1 /100 | #291 | Tragic $73,823 |
| Comanche | 0.1 /100 | #292 | Tragic $73,747 |
| Immigrants | Cabo Verde | 0.1 /100 | #293 | Tragic $73,515 |
| Blackfeet | 0.1 /100 | #294 | Tragic $73,509 |
| Cubans | 0.1 /100 | #295 | Tragic $73,392 |
| Haitians | 0.1 /100 | #296 | Tragic $73,306 |
| Immigrants | Mexico | 0.0 /100 | #297 | Tragic $73,160 |