Soviet Union vs Immigrants from Armenia Median Household Income
COMPARE
Soviet Union
Immigrants from Armenia
Median Household Income
Median Household Income Comparison
Soviet Union
Immigrants from Armenia
$95,098
MEDIAN HOUSEHOLD INCOME
99.8/ 100
METRIC RATING
58th/ 347
METRIC RANK
$83,555
MEDIAN HOUSEHOLD INCOME
27.0/ 100
METRIC RATING
195th/ 347
METRIC RANK
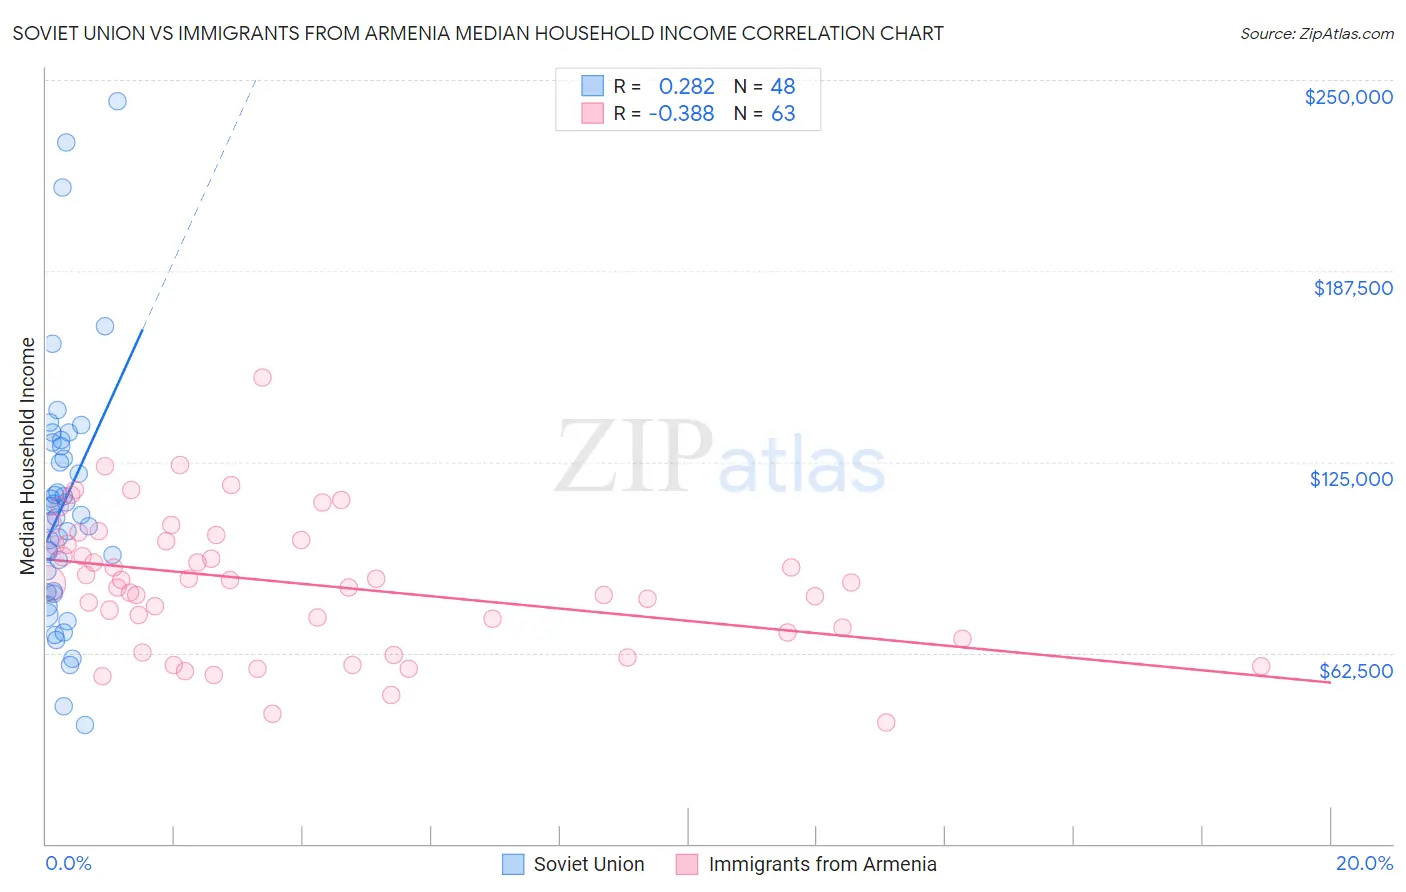
Soviet Union vs Immigrants from Armenia Median Household Income Correlation Chart
The statistical analysis conducted on geographies consisting of 43,509,359 people shows a weak positive correlation between the proportion of Soviet Union and median household income in the United States with a correlation coefficient (R) of 0.282 and weighted average of $95,098. Similarly, the statistical analysis conducted on geographies consisting of 97,712,518 people shows a mild negative correlation between the proportion of Immigrants from Armenia and median household income in the United States with a correlation coefficient (R) of -0.388 and weighted average of $83,555, a difference of 13.8%.
Median Household Income Correlation Summary
| Measurement | Soviet Union | Immigrants from Armenia |
| Minimum | $38,670 | $39,713 |
| Maximum | $243,125 | $152,803 |
| Range | $204,455 | $113,090 |
| Mean | $111,162 | $85,202 |
| Median | $107,165 | $85,651 |
| Interquartile 25% (IQ1) | $82,608 | $69,102 |
| Interquartile 75% (IQ3) | $130,577 | $99,318 |
| Interquartile Range (IQR) | $47,969 | $30,216 |
| Standard Deviation (Sample) | $41,880 | $22,242 |
| Standard Deviation (Population) | $41,441 | $22,064 |
Similar Demographics by Median Household Income
Demographics Similar to Soviet Union by Median Household Income
In terms of median household income, the demographic groups most similar to Soviet Union are New Zealander ($95,146, a difference of 0.050%), Immigrants from Europe ($95,032, a difference of 0.070%), Korean ($95,018, a difference of 0.080%), Laotian ($94,990, a difference of 0.11%), and Immigrants from Austria ($95,277, a difference of 0.19%).
| Demographics | Rating | Rank | Median Household Income |
| Estonians | 99.9 /100 | #51 | Exceptional $95,930 |
| Immigrants | South Africa | 99.9 /100 | #52 | Exceptional $95,800 |
| Paraguayans | 99.9 /100 | #53 | Exceptional $95,737 |
| Egyptians | 99.9 /100 | #54 | Exceptional $95,673 |
| Immigrants | Czechoslovakia | 99.9 /100 | #55 | Exceptional $95,319 |
| Immigrants | Austria | 99.9 /100 | #56 | Exceptional $95,277 |
| New Zealanders | 99.8 /100 | #57 | Exceptional $95,146 |
| Soviet Union | 99.8 /100 | #58 | Exceptional $95,098 |
| Immigrants | Europe | 99.8 /100 | #59 | Exceptional $95,032 |
| Koreans | 99.8 /100 | #60 | Exceptional $95,018 |
| Laotians | 99.8 /100 | #61 | Exceptional $94,990 |
| Immigrants | Norway | 99.8 /100 | #62 | Exceptional $94,846 |
| Greeks | 99.8 /100 | #63 | Exceptional $94,735 |
| Immigrants | Netherlands | 99.7 /100 | #64 | Exceptional $94,411 |
| Immigrants | Belarus | 99.7 /100 | #65 | Exceptional $94,399 |
Demographics Similar to Immigrants from Armenia by Median Household Income
In terms of median household income, the demographic groups most similar to Immigrants from Armenia are Ghanaian ($83,582, a difference of 0.030%), Finnish ($83,607, a difference of 0.060%), Welsh ($83,628, a difference of 0.090%), French ($83,468, a difference of 0.10%), and Aleut ($83,446, a difference of 0.13%).
| Demographics | Rating | Rank | Median Household Income |
| Tlingit-Haida | 32.6 /100 | #188 | Fair $83,968 |
| Immigrants | Colombia | 31.7 /100 | #189 | Fair $83,902 |
| Slovaks | 30.2 /100 | #190 | Fair $83,798 |
| Iraqis | 29.6 /100 | #191 | Fair $83,753 |
| Welsh | 28.0 /100 | #192 | Fair $83,628 |
| Finns | 27.7 /100 | #193 | Fair $83,607 |
| Ghanaians | 27.4 /100 | #194 | Fair $83,582 |
| Immigrants | Armenia | 27.0 /100 | #195 | Fair $83,555 |
| French | 26.0 /100 | #196 | Fair $83,468 |
| Aleuts | 25.7 /100 | #197 | Fair $83,446 |
| Japanese | 25.1 /100 | #198 | Fair $83,395 |
| Germans | 24.6 /100 | #199 | Fair $83,358 |
| Tsimshian | 24.5 /100 | #200 | Fair $83,346 |
| Spanish | 24.4 /100 | #201 | Fair $83,343 |
| Immigrants | Thailand | 24.3 /100 | #202 | Fair $83,327 |