Immigrants from Korea vs Alaskan Athabascan Householder Income Ages 45 - 64 years
COMPARE
Immigrants from Korea
Alaskan Athabascan
Householder Income Ages 45 - 64 years
Householder Income Ages 45 - 64 years Comparison
Immigrants from Korea
Alaskan Athabascans
$121,243
HOUSEHOLDER INCOME AGES 45 - 64 YEARS
100.0/ 100
METRIC RATING
18th/ 347
METRIC RANK
$90,951
HOUSEHOLDER INCOME AGES 45 - 64 YEARS
0.9/ 100
METRIC RATING
247th/ 347
METRIC RANK
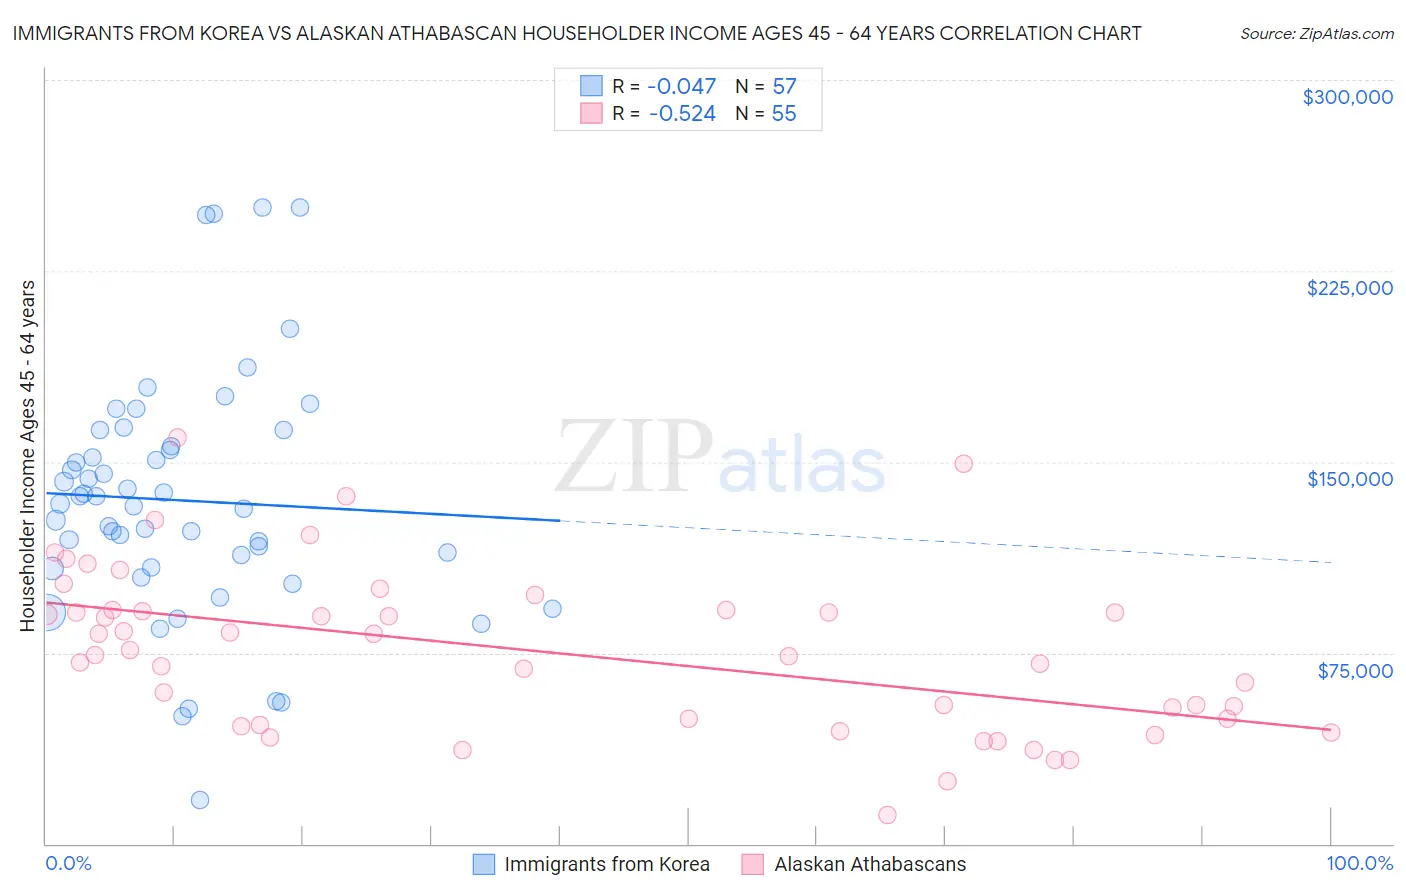
Immigrants from Korea vs Alaskan Athabascan Householder Income Ages 45 - 64 years Correlation Chart
The statistical analysis conducted on geographies consisting of 415,490,363 people shows no correlation between the proportion of Immigrants from Korea and household income with householder between the ages 45 and 64 in the United States with a correlation coefficient (R) of -0.047 and weighted average of $121,243. Similarly, the statistical analysis conducted on geographies consisting of 45,798,258 people shows a substantial negative correlation between the proportion of Alaskan Athabascans and household income with householder between the ages 45 and 64 in the United States with a correlation coefficient (R) of -0.524 and weighted average of $90,951, a difference of 33.3%.
Householder Income Ages 45 - 64 years Correlation Summary
| Measurement | Immigrants from Korea | Alaskan Athabascan |
| Minimum | $17,326 | $11,250 |
| Maximum | $250,001 | $159,813 |
| Range | $232,675 | $148,563 |
| Mean | $134,865 | $75,223 |
| Median | $133,392 | $74,256 |
| Interquartile 25% (IQ1) | $108,375 | $46,429 |
| Interquartile 75% (IQ3) | $159,271 | $91,990 |
| Interquartile Range (IQR) | $50,896 | $45,561 |
| Standard Deviation (Sample) | $48,086 | $32,152 |
| Standard Deviation (Population) | $47,662 | $31,858 |
Similar Demographics by Householder Income Ages 45 - 64 years
Demographics Similar to Immigrants from Korea by Householder Income Ages 45 - 64 years
In terms of householder income ages 45 - 64 years, the demographic groups most similar to Immigrants from Korea are Burmese ($121,444, a difference of 0.17%), Eastern European ($120,684, a difference of 0.46%), Immigrants from China ($122,178, a difference of 0.77%), Immigrants from Eastern Asia ($122,222, a difference of 0.81%), and Indian (Asian) ($122,343, a difference of 0.91%).
| Demographics | Rating | Rank | Householder Income Ages 45 - 64 years |
| Cypriots | 100.0 /100 | #11 | Exceptional $123,396 |
| Immigrants | Israel | 100.0 /100 | #12 | Exceptional $122,893 |
| Immigrants | Ireland | 100.0 /100 | #13 | Exceptional $122,757 |
| Indians (Asian) | 100.0 /100 | #14 | Exceptional $122,343 |
| Immigrants | Eastern Asia | 100.0 /100 | #15 | Exceptional $122,222 |
| Immigrants | China | 100.0 /100 | #16 | Exceptional $122,178 |
| Burmese | 100.0 /100 | #17 | Exceptional $121,444 |
| Immigrants | Korea | 100.0 /100 | #18 | Exceptional $121,243 |
| Eastern Europeans | 100.0 /100 | #19 | Exceptional $120,684 |
| Immigrants | Australia | 100.0 /100 | #20 | Exceptional $119,308 |
| Immigrants | Sri Lanka | 100.0 /100 | #21 | Exceptional $119,094 |
| Immigrants | Belgium | 100.0 /100 | #22 | Exceptional $118,932 |
| Bolivians | 100.0 /100 | #23 | Exceptional $118,871 |
| Immigrants | Japan | 100.0 /100 | #24 | Exceptional $118,498 |
| Asians | 100.0 /100 | #25 | Exceptional $118,426 |
Demographics Similar to Alaskan Athabascans by Householder Income Ages 45 - 64 years
In terms of householder income ages 45 - 64 years, the demographic groups most similar to Alaskan Athabascans are Central American ($90,951, a difference of 0.0%), Guyanese ($90,966, a difference of 0.020%), Immigrants from Laos ($90,909, a difference of 0.050%), Mexican American Indian ($90,811, a difference of 0.15%), and Subsaharan African ($90,691, a difference of 0.29%).
| Demographics | Rating | Rank | Householder Income Ages 45 - 64 years |
| Immigrants | Burma/Myanmar | 1.1 /100 | #240 | Tragic $91,385 |
| Trinidadians and Tobagonians | 1.1 /100 | #241 | Tragic $91,357 |
| Inupiat | 1.1 /100 | #242 | Tragic $91,355 |
| Immigrants | Trinidad and Tobago | 1.1 /100 | #243 | Tragic $91,347 |
| Immigrants | Middle Africa | 1.1 /100 | #244 | Tragic $91,293 |
| Guyanese | 0.9 /100 | #245 | Tragic $90,966 |
| Central Americans | 0.9 /100 | #246 | Tragic $90,951 |
| Alaskan Athabascans | 0.9 /100 | #247 | Tragic $90,951 |
| Immigrants | Laos | 0.9 /100 | #248 | Tragic $90,909 |
| Mexican American Indians | 0.8 /100 | #249 | Tragic $90,811 |
| Sub-Saharan Africans | 0.8 /100 | #250 | Tragic $90,691 |
| Americans | 0.7 /100 | #251 | Tragic $90,536 |
| Marshallese | 0.7 /100 | #252 | Tragic $90,455 |
| Barbadians | 0.6 /100 | #253 | Tragic $90,266 |
| Immigrants | Guyana | 0.6 /100 | #254 | Tragic $90,186 |