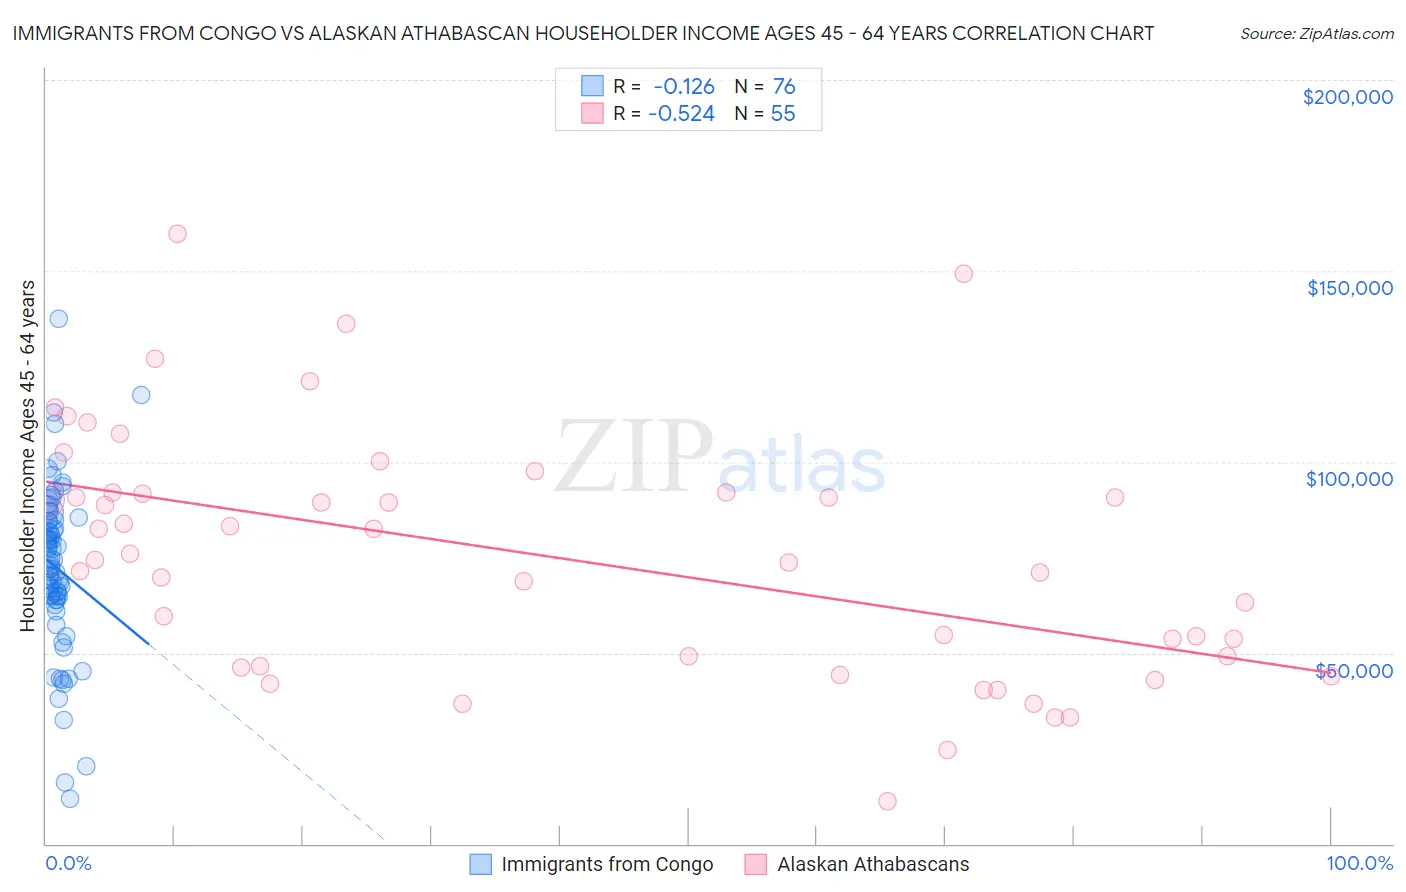
Immigrants from Congo vs Alaskan Athabascan Householder Income Ages 45 - 64 years
COMPARE
Immigrants from Congo
Alaskan Athabascan
Householder Income Ages 45 - 64 years
Householder Income Ages 45 - 64 years Comparison
Immigrants from Congo
Alaskan Athabascans
$77,850
HOUSEHOLDER INCOME AGES 45 - 64 YEARS
0.0/ 100
METRIC RATING
333rd/ 347
METRIC RANK
$90,951
HOUSEHOLDER INCOME AGES 45 - 64 YEARS
0.9/ 100
METRIC RATING
247th/ 347
METRIC RANK
Immigrants from Congo vs Alaskan Athabascan Householder Income Ages 45 - 64 years Correlation Chart
The statistical analysis conducted on geographies consisting of 92,054,371 people shows a poor negative correlation between the proportion of Immigrants from Congo and household income with householder between the ages 45 and 64 in the United States with a correlation coefficient (R) of -0.126 and weighted average of $77,850. Similarly, the statistical analysis conducted on geographies consisting of 45,798,258 people shows a substantial negative correlation between the proportion of Alaskan Athabascans and household income with householder between the ages 45 and 64 in the United States with a correlation coefficient (R) of -0.524 and weighted average of $90,951, a difference of 16.8%.
Householder Income Ages 45 - 64 years Correlation Summary
| Measurement | Immigrants from Congo | Alaskan Athabascan |
| Minimum | $11,745 | $11,250 |
| Maximum | $137,368 | $159,813 |
| Range | $125,623 | $148,563 |
| Mean | $72,239 | $75,223 |
| Median | $73,295 | $74,256 |
| Interquartile 25% (IQ1) | $64,310 | $46,429 |
| Interquartile 75% (IQ3) | $84,654 | $91,990 |
| Interquartile Range (IQR) | $20,344 | $45,561 |
| Standard Deviation (Sample) | $21,800 | $32,152 |
| Standard Deviation (Population) | $21,656 | $31,858 |
Similar Demographics by Householder Income Ages 45 - 64 years
Demographics Similar to Immigrants from Congo by Householder Income Ages 45 - 64 years
In terms of householder income ages 45 - 64 years, the demographic groups most similar to Immigrants from Congo are Black/African American ($78,556, a difference of 0.91%), Menominee ($76,903, a difference of 1.2%), Immigrants from Dominican Republic ($78,836, a difference of 1.3%), Creek ($78,960, a difference of 1.4%), and Dutch West Indian ($79,171, a difference of 1.7%).
| Demographics | Rating | Rank | Householder Income Ages 45 - 64 years |
| Dominicans | 0.0 /100 | #326 | Tragic $80,623 |
| Seminole | 0.0 /100 | #327 | Tragic $80,077 |
| Natives/Alaskans | 0.0 /100 | #328 | Tragic $79,816 |
| Dutch West Indians | 0.0 /100 | #329 | Tragic $79,171 |
| Creek | 0.0 /100 | #330 | Tragic $78,960 |
| Immigrants | Dominican Republic | 0.0 /100 | #331 | Tragic $78,836 |
| Blacks/African Americans | 0.0 /100 | #332 | Tragic $78,556 |
| Immigrants | Congo | 0.0 /100 | #333 | Tragic $77,850 |
| Menominee | 0.0 /100 | #334 | Tragic $76,903 |
| Cheyenne | 0.0 /100 | #335 | Tragic $76,362 |
| Arapaho | 0.0 /100 | #336 | Tragic $75,945 |
| Pueblo | 0.0 /100 | #337 | Tragic $75,601 |
| Hopi | 0.0 /100 | #338 | Tragic $75,562 |
| Kiowa | 0.0 /100 | #339 | Tragic $74,815 |
| Immigrants | Yemen | 0.0 /100 | #340 | Tragic $74,575 |
Demographics Similar to Alaskan Athabascans by Householder Income Ages 45 - 64 years
In terms of householder income ages 45 - 64 years, the demographic groups most similar to Alaskan Athabascans are Central American ($90,951, a difference of 0.0%), Guyanese ($90,966, a difference of 0.020%), Immigrants from Laos ($90,909, a difference of 0.050%), Mexican American Indian ($90,811, a difference of 0.15%), and Subsaharan African ($90,691, a difference of 0.29%).
| Demographics | Rating | Rank | Householder Income Ages 45 - 64 years |
| Immigrants | Burma/Myanmar | 1.1 /100 | #240 | Tragic $91,385 |
| Trinidadians and Tobagonians | 1.1 /100 | #241 | Tragic $91,357 |
| Inupiat | 1.1 /100 | #242 | Tragic $91,355 |
| Immigrants | Trinidad and Tobago | 1.1 /100 | #243 | Tragic $91,347 |
| Immigrants | Middle Africa | 1.1 /100 | #244 | Tragic $91,293 |
| Guyanese | 0.9 /100 | #245 | Tragic $90,966 |
| Central Americans | 0.9 /100 | #246 | Tragic $90,951 |
| Alaskan Athabascans | 0.9 /100 | #247 | Tragic $90,951 |
| Immigrants | Laos | 0.9 /100 | #248 | Tragic $90,909 |
| Mexican American Indians | 0.8 /100 | #249 | Tragic $90,811 |
| Sub-Saharan Africans | 0.8 /100 | #250 | Tragic $90,691 |
| Americans | 0.7 /100 | #251 | Tragic $90,536 |
| Marshallese | 0.7 /100 | #252 | Tragic $90,455 |
| Barbadians | 0.6 /100 | #253 | Tragic $90,266 |
| Immigrants | Guyana | 0.6 /100 | #254 | Tragic $90,186 |