Slavic vs Alaskan Athabascan High School Diploma
COMPARE
Slavic
Alaskan Athabascan
High School Diploma
High School Diploma Comparison
Slavs
Alaskan Athabascans
91.0%
HIGH SCHOOL DIPLOMA
99.7/ 100
METRIC RATING
58th/ 347
METRIC RANK
90.9%
HIGH SCHOOL DIPLOMA
99.4/ 100
METRIC RATING
71st/ 347
METRIC RANK
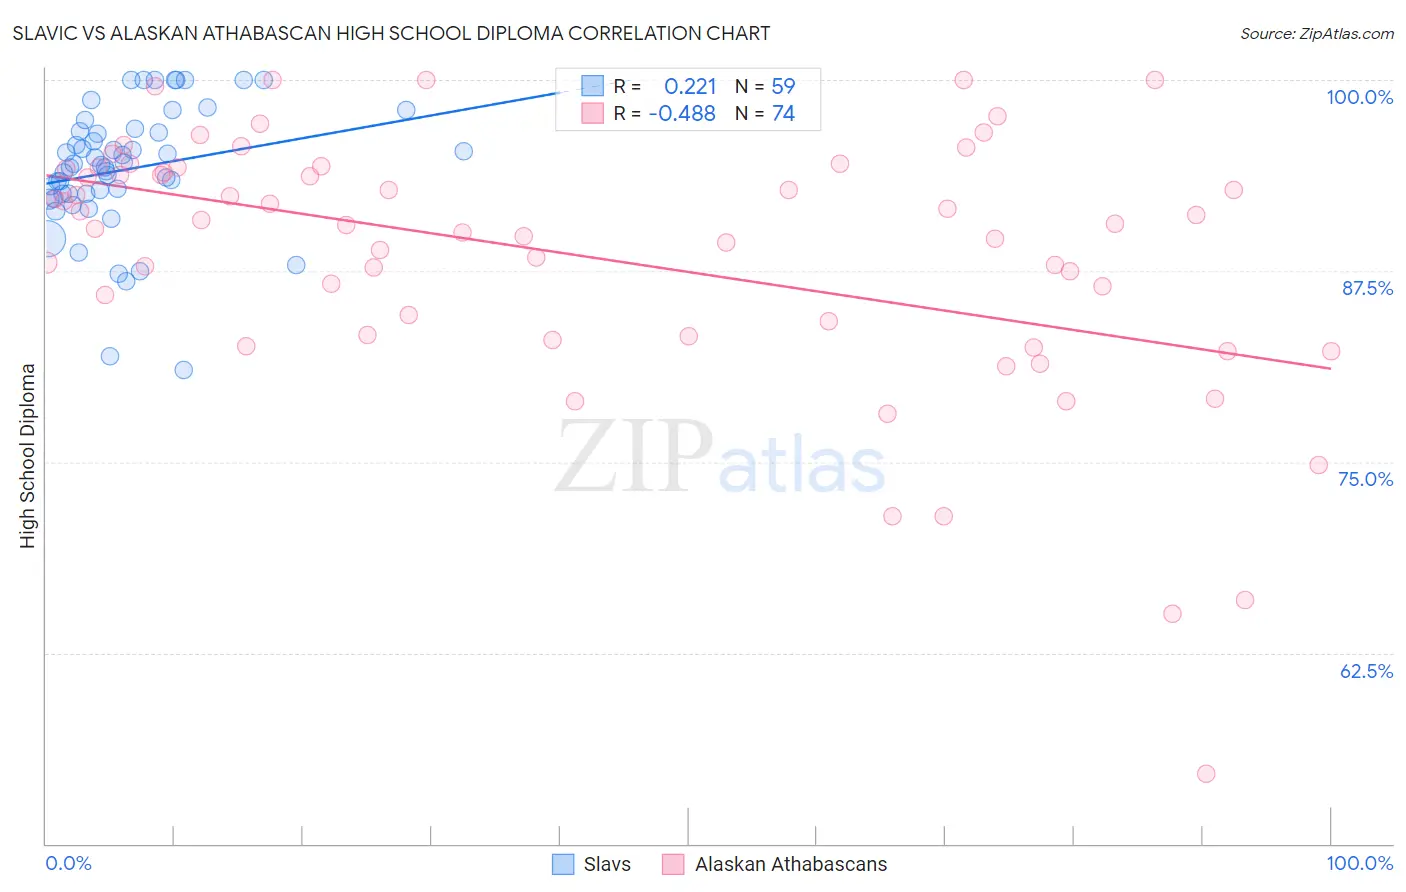
Slavic vs Alaskan Athabascan High School Diploma Correlation Chart
The statistical analysis conducted on geographies consisting of 270,868,354 people shows a weak positive correlation between the proportion of Slavs and percentage of population with at least high school diploma education in the United States with a correlation coefficient (R) of 0.221 and weighted average of 91.0%. Similarly, the statistical analysis conducted on geographies consisting of 45,820,221 people shows a moderate negative correlation between the proportion of Alaskan Athabascans and percentage of population with at least high school diploma education in the United States with a correlation coefficient (R) of -0.488 and weighted average of 90.9%, a difference of 0.18%.
High School Diploma Correlation Summary
| Measurement | Slavic | Alaskan Athabascan |
| Minimum | 81.0% | 54.5% |
| Maximum | 100.0% | 100.0% |
| Range | 19.0% | 45.5% |
| Mean | 94.2% | 88.4% |
| Median | 94.5% | 90.5% |
| Interquartile 25% (IQ1) | 92.6% | 83.3% |
| Interquartile 75% (IQ3) | 96.7% | 94.2% |
| Interquartile Range (IQR) | 4.1% | 10.9% |
| Standard Deviation (Sample) | 4.2% | 8.6% |
| Standard Deviation (Population) | 4.1% | 8.5% |
Demographics Similar to Slavs and Alaskan Athabascans by High School Diploma
In terms of high school diploma, the demographic groups most similar to Slavs are Immigrants from North America (91.0%, a difference of 0.0%), Zimbabwean (91.1%, a difference of 0.010%), Immigrants from Canada (91.1%, a difference of 0.030%), Immigrants from Japan (91.0%, a difference of 0.030%), and Immigrants from Taiwan (91.0%, a difference of 0.040%). Similarly, the demographic groups most similar to Alaskan Athabascans are Immigrants from Latvia (90.9%, a difference of 0.0%), Soviet Union (90.9%, a difference of 0.0%), French Canadian (90.9%, a difference of 0.010%), Immigrants from South Central Asia (90.9%, a difference of 0.030%), and Czechoslovakian (90.9%, a difference of 0.040%).
| Demographics | Rating | Rank | High School Diploma |
| Macedonians | 99.7 /100 | #54 | Exceptional 91.1% |
| Serbians | 99.7 /100 | #55 | Exceptional 91.1% |
| Immigrants | Canada | 99.7 /100 | #56 | Exceptional 91.1% |
| Zimbabweans | 99.7 /100 | #57 | Exceptional 91.1% |
| Slavs | 99.7 /100 | #58 | Exceptional 91.0% |
| Immigrants | North America | 99.7 /100 | #59 | Exceptional 91.0% |
| Immigrants | Japan | 99.6 /100 | #60 | Exceptional 91.0% |
| Immigrants | Taiwan | 99.6 /100 | #61 | Exceptional 91.0% |
| Austrians | 99.6 /100 | #62 | Exceptional 91.0% |
| Immigrants | Netherlands | 99.6 /100 | #63 | Exceptional 91.0% |
| Ukrainians | 99.6 /100 | #64 | Exceptional 91.0% |
| Immigrants | South Africa | 99.6 /100 | #65 | Exceptional 91.0% |
| French | 99.5 /100 | #66 | Exceptional 91.0% |
| Immigrants | Iran | 99.5 /100 | #67 | Exceptional 90.9% |
| Czechoslovakians | 99.5 /100 | #68 | Exceptional 90.9% |
| French Canadians | 99.5 /100 | #69 | Exceptional 90.9% |
| Immigrants | Latvia | 99.5 /100 | #70 | Exceptional 90.9% |
| Alaskan Athabascans | 99.4 /100 | #71 | Exceptional 90.9% |
| Soviet Union | 99.4 /100 | #72 | Exceptional 90.9% |
| Immigrants | South Central Asia | 99.4 /100 | #73 | Exceptional 90.9% |
| Immigrants | Czechoslovakia | 99.4 /100 | #74 | Exceptional 90.9% |