Sioux vs Immigrants from Ghana Median Earnings
COMPARE
Sioux
Immigrants from Ghana
Median Earnings
Median Earnings Comparison
Sioux
Immigrants from Ghana
$39,448
MEDIAN EARNINGS
0.0/ 100
METRIC RATING
328th/ 347
METRIC RANK
$45,641
MEDIAN EARNINGS
24.8/ 100
METRIC RATING
206th/ 347
METRIC RANK
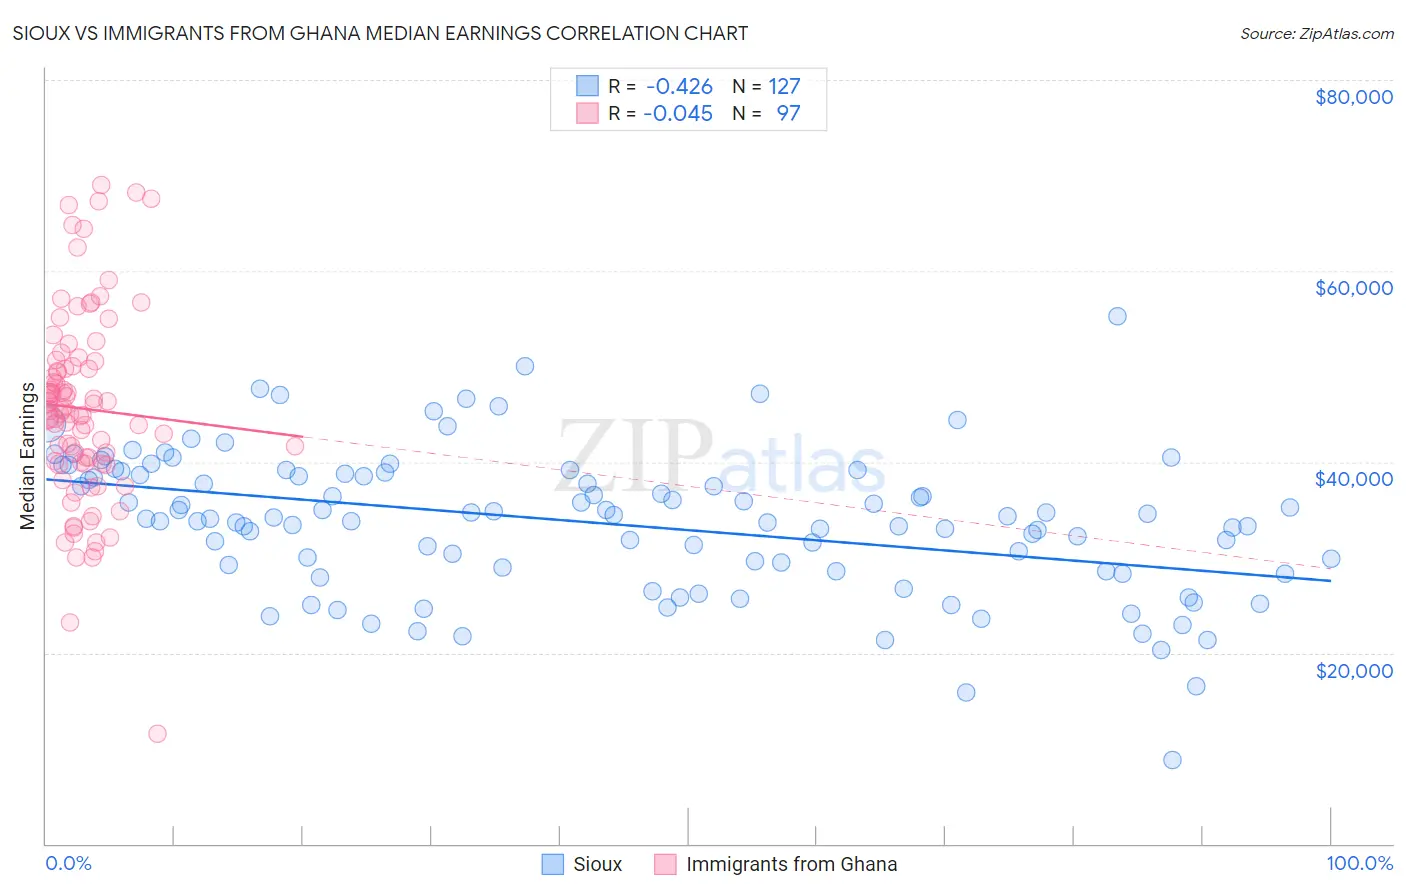
Sioux vs Immigrants from Ghana Median Earnings Correlation Chart
The statistical analysis conducted on geographies consisting of 234,180,088 people shows a moderate negative correlation between the proportion of Sioux and median earnings in the United States with a correlation coefficient (R) of -0.426 and weighted average of $39,448. Similarly, the statistical analysis conducted on geographies consisting of 199,945,483 people shows no correlation between the proportion of Immigrants from Ghana and median earnings in the United States with a correlation coefficient (R) of -0.045 and weighted average of $45,641, a difference of 15.7%.
Median Earnings Correlation Summary
| Measurement | Sioux | Immigrants from Ghana |
| Minimum | $8,827 | $11,479 |
| Maximum | $55,313 | $69,009 |
| Range | $46,486 | $57,530 |
| Mean | $33,596 | $45,584 |
| Median | $34,101 | $45,406 |
| Interquartile 25% (IQ1) | $28,589 | $39,912 |
| Interquartile 75% (IQ3) | $38,812 | $50,257 |
| Interquartile Range (IQR) | $10,224 | $10,345 |
| Standard Deviation (Sample) | $7,478 | $10,012 |
| Standard Deviation (Population) | $7,448 | $9,960 |
Similar Demographics by Median Earnings
Demographics Similar to Sioux by Median Earnings
In terms of median earnings, the demographic groups most similar to Sioux are Yuman ($39,523, a difference of 0.19%), Immigrants from Yemen ($39,540, a difference of 0.23%), Creek ($39,648, a difference of 0.51%), Kiowa ($39,232, a difference of 0.55%), and Ottawa ($39,721, a difference of 0.69%).
| Demographics | Rating | Rank | Median Earnings |
| Mexicans | 0.0 /100 | #321 | Tragic $39,834 |
| Immigrants | Central America | 0.0 /100 | #322 | Tragic $39,762 |
| Bahamians | 0.0 /100 | #323 | Tragic $39,735 |
| Ottawa | 0.0 /100 | #324 | Tragic $39,721 |
| Creek | 0.0 /100 | #325 | Tragic $39,648 |
| Immigrants | Yemen | 0.0 /100 | #326 | Tragic $39,540 |
| Yuman | 0.0 /100 | #327 | Tragic $39,523 |
| Sioux | 0.0 /100 | #328 | Tragic $39,448 |
| Kiowa | 0.0 /100 | #329 | Tragic $39,232 |
| Immigrants | Congo | 0.0 /100 | #330 | Tragic $39,169 |
| Immigrants | Mexico | 0.0 /100 | #331 | Tragic $39,114 |
| Yakama | 0.0 /100 | #332 | Tragic $39,107 |
| Houma | 0.0 /100 | #333 | Tragic $38,949 |
| Spanish American Indians | 0.0 /100 | #334 | Tragic $38,907 |
| Natives/Alaskans | 0.0 /100 | #335 | Tragic $38,896 |
Demographics Similar to Immigrants from Ghana by Median Earnings
In terms of median earnings, the demographic groups most similar to Immigrants from Ghana are Tongan ($45,665, a difference of 0.050%), Immigrants from Senegal ($45,611, a difference of 0.070%), Immigrants from Uruguay ($45,682, a difference of 0.090%), Immigrants from Bosnia and Herzegovina ($45,600, a difference of 0.090%), and Immigrants from Thailand ($45,598, a difference of 0.10%).
| Demographics | Rating | Rank | Median Earnings |
| Immigrants | Barbados | 29.6 /100 | #199 | Fair $45,816 |
| Immigrants | Azores | 29.5 /100 | #200 | Fair $45,812 |
| Celtics | 27.2 /100 | #201 | Fair $45,732 |
| Immigrants | Trinidad and Tobago | 27.1 /100 | #202 | Fair $45,729 |
| Welsh | 26.6 /100 | #203 | Fair $45,710 |
| Immigrants | Uruguay | 25.9 /100 | #204 | Fair $45,682 |
| Tongans | 25.4 /100 | #205 | Fair $45,665 |
| Immigrants | Ghana | 24.8 /100 | #206 | Fair $45,641 |
| Immigrants | Senegal | 24.0 /100 | #207 | Fair $45,611 |
| Immigrants | Bosnia and Herzegovina | 23.7 /100 | #208 | Fair $45,600 |
| Immigrants | Thailand | 23.7 /100 | #209 | Fair $45,598 |
| Immigrants | Grenada | 23.6 /100 | #210 | Fair $45,596 |
| Panamanians | 23.5 /100 | #211 | Fair $45,593 |
| Bermudans | 23.5 /100 | #212 | Fair $45,593 |
| Immigrants | Colombia | 22.4 /100 | #213 | Fair $45,550 |