Sioux vs Immigrants from Australia Median Earnings
COMPARE
Sioux
Immigrants from Australia
Median Earnings
Median Earnings Comparison
Sioux
Immigrants from Australia
$39,448
MEDIAN EARNINGS
0.0/ 100
METRIC RATING
328th/ 347
METRIC RANK
$56,305
MEDIAN EARNINGS
100.0/ 100
METRIC RATING
14th/ 347
METRIC RANK
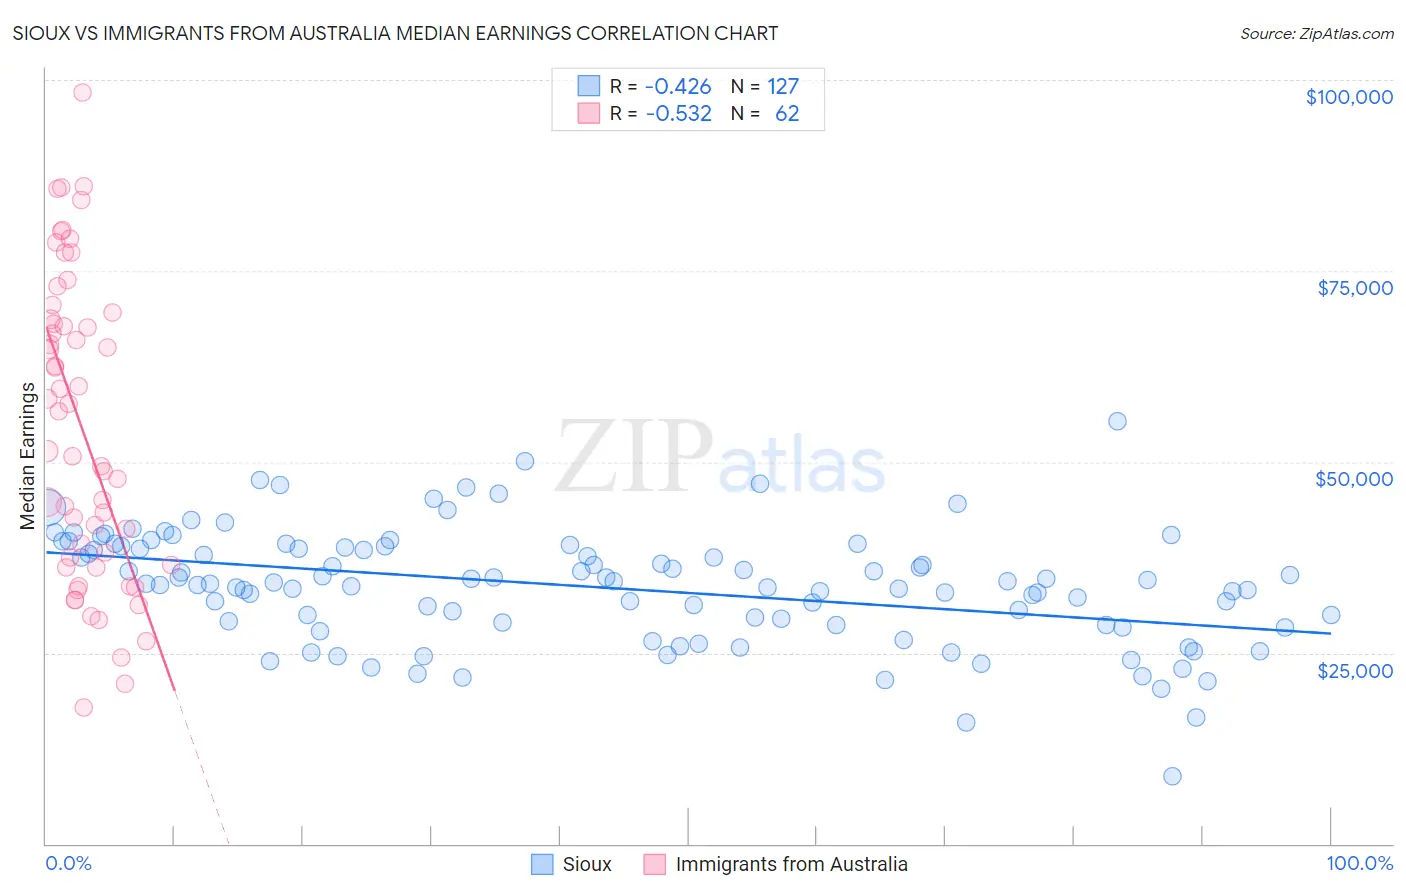
Sioux vs Immigrants from Australia Median Earnings Correlation Chart
The statistical analysis conducted on geographies consisting of 234,180,088 people shows a moderate negative correlation between the proportion of Sioux and median earnings in the United States with a correlation coefficient (R) of -0.426 and weighted average of $39,448. Similarly, the statistical analysis conducted on geographies consisting of 227,197,451 people shows a substantial negative correlation between the proportion of Immigrants from Australia and median earnings in the United States with a correlation coefficient (R) of -0.532 and weighted average of $56,305, a difference of 42.7%.
Median Earnings Correlation Summary
| Measurement | Sioux | Immigrants from Australia |
| Minimum | $8,827 | $17,795 |
| Maximum | $55,313 | $98,400 |
| Range | $46,486 | $80,605 |
| Mean | $33,596 | $54,359 |
| Median | $34,101 | $54,001 |
| Interquartile 25% (IQ1) | $28,589 | $36,563 |
| Interquartile 75% (IQ3) | $38,812 | $68,667 |
| Interquartile Range (IQR) | $10,224 | $32,104 |
| Standard Deviation (Sample) | $7,478 | $19,682 |
| Standard Deviation (Population) | $7,448 | $19,523 |
Similar Demographics by Median Earnings
Demographics Similar to Sioux by Median Earnings
In terms of median earnings, the demographic groups most similar to Sioux are Yuman ($39,523, a difference of 0.19%), Immigrants from Yemen ($39,540, a difference of 0.23%), Creek ($39,648, a difference of 0.51%), Kiowa ($39,232, a difference of 0.55%), and Ottawa ($39,721, a difference of 0.69%).
| Demographics | Rating | Rank | Median Earnings |
| Mexicans | 0.0 /100 | #321 | Tragic $39,834 |
| Immigrants | Central America | 0.0 /100 | #322 | Tragic $39,762 |
| Bahamians | 0.0 /100 | #323 | Tragic $39,735 |
| Ottawa | 0.0 /100 | #324 | Tragic $39,721 |
| Creek | 0.0 /100 | #325 | Tragic $39,648 |
| Immigrants | Yemen | 0.0 /100 | #326 | Tragic $39,540 |
| Yuman | 0.0 /100 | #327 | Tragic $39,523 |
| Sioux | 0.0 /100 | #328 | Tragic $39,448 |
| Kiowa | 0.0 /100 | #329 | Tragic $39,232 |
| Immigrants | Congo | 0.0 /100 | #330 | Tragic $39,169 |
| Immigrants | Mexico | 0.0 /100 | #331 | Tragic $39,114 |
| Yakama | 0.0 /100 | #332 | Tragic $39,107 |
| Houma | 0.0 /100 | #333 | Tragic $38,949 |
| Spanish American Indians | 0.0 /100 | #334 | Tragic $38,907 |
| Natives/Alaskans | 0.0 /100 | #335 | Tragic $38,896 |
Demographics Similar to Immigrants from Australia by Median Earnings
In terms of median earnings, the demographic groups most similar to Immigrants from Australia are Indian (Asian) ($56,253, a difference of 0.090%), Immigrants from Eastern Asia ($56,183, a difference of 0.22%), Immigrants from China ($56,638, a difference of 0.59%), Immigrants from Ireland ($56,854, a difference of 0.97%), and Immigrants from Israel ($57,034, a difference of 1.3%).
| Demographics | Rating | Rank | Median Earnings |
| Iranians | 100.0 /100 | #7 | Exceptional $58,474 |
| Immigrants | Iran | 100.0 /100 | #8 | Exceptional $57,612 |
| Okinawans | 100.0 /100 | #9 | Exceptional $57,550 |
| Immigrants | South Central Asia | 100.0 /100 | #10 | Exceptional $57,114 |
| Immigrants | Israel | 100.0 /100 | #11 | Exceptional $57,034 |
| Immigrants | Ireland | 100.0 /100 | #12 | Exceptional $56,854 |
| Immigrants | China | 100.0 /100 | #13 | Exceptional $56,638 |
| Immigrants | Australia | 100.0 /100 | #14 | Exceptional $56,305 |
| Indians (Asian) | 100.0 /100 | #15 | Exceptional $56,253 |
| Immigrants | Eastern Asia | 100.0 /100 | #16 | Exceptional $56,183 |
| Eastern Europeans | 100.0 /100 | #17 | Exceptional $55,084 |
| Immigrants | Japan | 100.0 /100 | #18 | Exceptional $54,938 |
| Immigrants | Belgium | 100.0 /100 | #19 | Exceptional $54,679 |
| Cypriots | 100.0 /100 | #20 | Exceptional $54,589 |
| Burmese | 100.0 /100 | #21 | Exceptional $54,559 |