Sioux vs Immigrants from Norway Median Earnings
COMPARE
Sioux
Immigrants from Norway
Median Earnings
Median Earnings Comparison
Sioux
Immigrants from Norway
$39,448
MEDIAN EARNINGS
0.0/ 100
METRIC RATING
328th/ 347
METRIC RANK
$51,758
MEDIAN EARNINGS
99.9/ 100
METRIC RATING
53rd/ 347
METRIC RANK
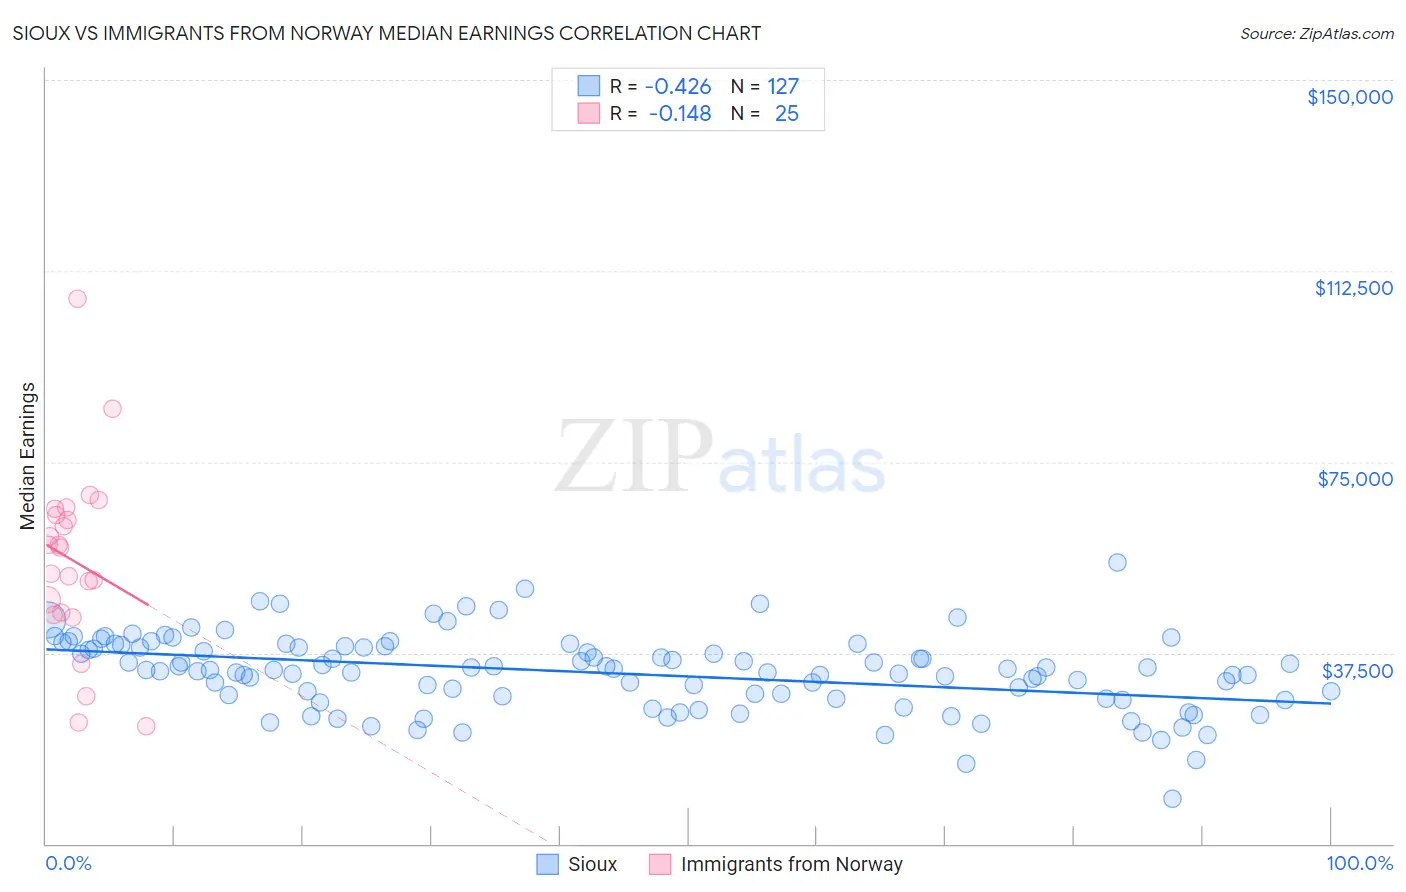
Sioux vs Immigrants from Norway Median Earnings Correlation Chart
The statistical analysis conducted on geographies consisting of 234,180,088 people shows a moderate negative correlation between the proportion of Sioux and median earnings in the United States with a correlation coefficient (R) of -0.426 and weighted average of $39,448. Similarly, the statistical analysis conducted on geographies consisting of 116,707,889 people shows a poor negative correlation between the proportion of Immigrants from Norway and median earnings in the United States with a correlation coefficient (R) of -0.148 and weighted average of $51,758, a difference of 31.2%.
Median Earnings Correlation Summary
| Measurement | Sioux | Immigrants from Norway |
| Minimum | $8,827 | $23,125 |
| Maximum | $55,313 | $106,979 |
| Range | $46,486 | $83,854 |
| Mean | $33,596 | $55,577 |
| Median | $34,101 | $58,159 |
| Interquartile 25% (IQ1) | $28,589 | $45,162 |
| Interquartile 75% (IQ3) | $38,812 | $65,163 |
| Interquartile Range (IQR) | $10,224 | $20,000 |
| Standard Deviation (Sample) | $7,478 | $18,163 |
| Standard Deviation (Population) | $7,448 | $17,796 |
Similar Demographics by Median Earnings
Demographics Similar to Sioux by Median Earnings
In terms of median earnings, the demographic groups most similar to Sioux are Yuman ($39,523, a difference of 0.19%), Immigrants from Yemen ($39,540, a difference of 0.23%), Creek ($39,648, a difference of 0.51%), Kiowa ($39,232, a difference of 0.55%), and Ottawa ($39,721, a difference of 0.69%).
| Demographics | Rating | Rank | Median Earnings |
| Mexicans | 0.0 /100 | #321 | Tragic $39,834 |
| Immigrants | Central America | 0.0 /100 | #322 | Tragic $39,762 |
| Bahamians | 0.0 /100 | #323 | Tragic $39,735 |
| Ottawa | 0.0 /100 | #324 | Tragic $39,721 |
| Creek | 0.0 /100 | #325 | Tragic $39,648 |
| Immigrants | Yemen | 0.0 /100 | #326 | Tragic $39,540 |
| Yuman | 0.0 /100 | #327 | Tragic $39,523 |
| Sioux | 0.0 /100 | #328 | Tragic $39,448 |
| Kiowa | 0.0 /100 | #329 | Tragic $39,232 |
| Immigrants | Congo | 0.0 /100 | #330 | Tragic $39,169 |
| Immigrants | Mexico | 0.0 /100 | #331 | Tragic $39,114 |
| Yakama | 0.0 /100 | #332 | Tragic $39,107 |
| Houma | 0.0 /100 | #333 | Tragic $38,949 |
| Spanish American Indians | 0.0 /100 | #334 | Tragic $38,907 |
| Natives/Alaskans | 0.0 /100 | #335 | Tragic $38,896 |
Demographics Similar to Immigrants from Norway by Median Earnings
In terms of median earnings, the demographic groups most similar to Immigrants from Norway are Estonian ($51,772, a difference of 0.030%), Immigrants from Indonesia ($51,715, a difference of 0.080%), Egyptian ($51,701, a difference of 0.11%), Immigrants from Austria ($51,826, a difference of 0.13%), and Immigrants from Pakistan ($51,693, a difference of 0.13%).
| Demographics | Rating | Rank | Median Earnings |
| Bhutanese | 100.0 /100 | #46 | Exceptional $52,297 |
| Australians | 100.0 /100 | #47 | Exceptional $52,294 |
| Immigrants | Europe | 100.0 /100 | #48 | Exceptional $52,195 |
| Bolivians | 100.0 /100 | #49 | Exceptional $52,005 |
| Immigrants | South Africa | 100.0 /100 | #50 | Exceptional $51,850 |
| Immigrants | Austria | 99.9 /100 | #51 | Exceptional $51,826 |
| Estonians | 99.9 /100 | #52 | Exceptional $51,772 |
| Immigrants | Norway | 99.9 /100 | #53 | Exceptional $51,758 |
| Immigrants | Indonesia | 99.9 /100 | #54 | Exceptional $51,715 |
| Egyptians | 99.9 /100 | #55 | Exceptional $51,701 |
| Immigrants | Pakistan | 99.9 /100 | #56 | Exceptional $51,693 |
| Immigrants | Eastern Europe | 99.9 /100 | #57 | Exceptional $51,624 |
| Immigrants | Bolivia | 99.9 /100 | #58 | Exceptional $51,605 |
| Immigrants | Croatia | 99.9 /100 | #59 | Exceptional $51,581 |
| Immigrants | Serbia | 99.9 /100 | #60 | Exceptional $51,557 |