Shoshone vs Tlingit-Haida Median Household Income
COMPARE
Shoshone
Tlingit-Haida
Median Household Income
Median Household Income Comparison
Shoshone
Tlingit-Haida
$72,660
MEDIAN HOUSEHOLD INCOME
0.0/ 100
METRIC RATING
302nd/ 347
METRIC RANK
$83,968
MEDIAN HOUSEHOLD INCOME
32.6/ 100
METRIC RATING
188th/ 347
METRIC RANK
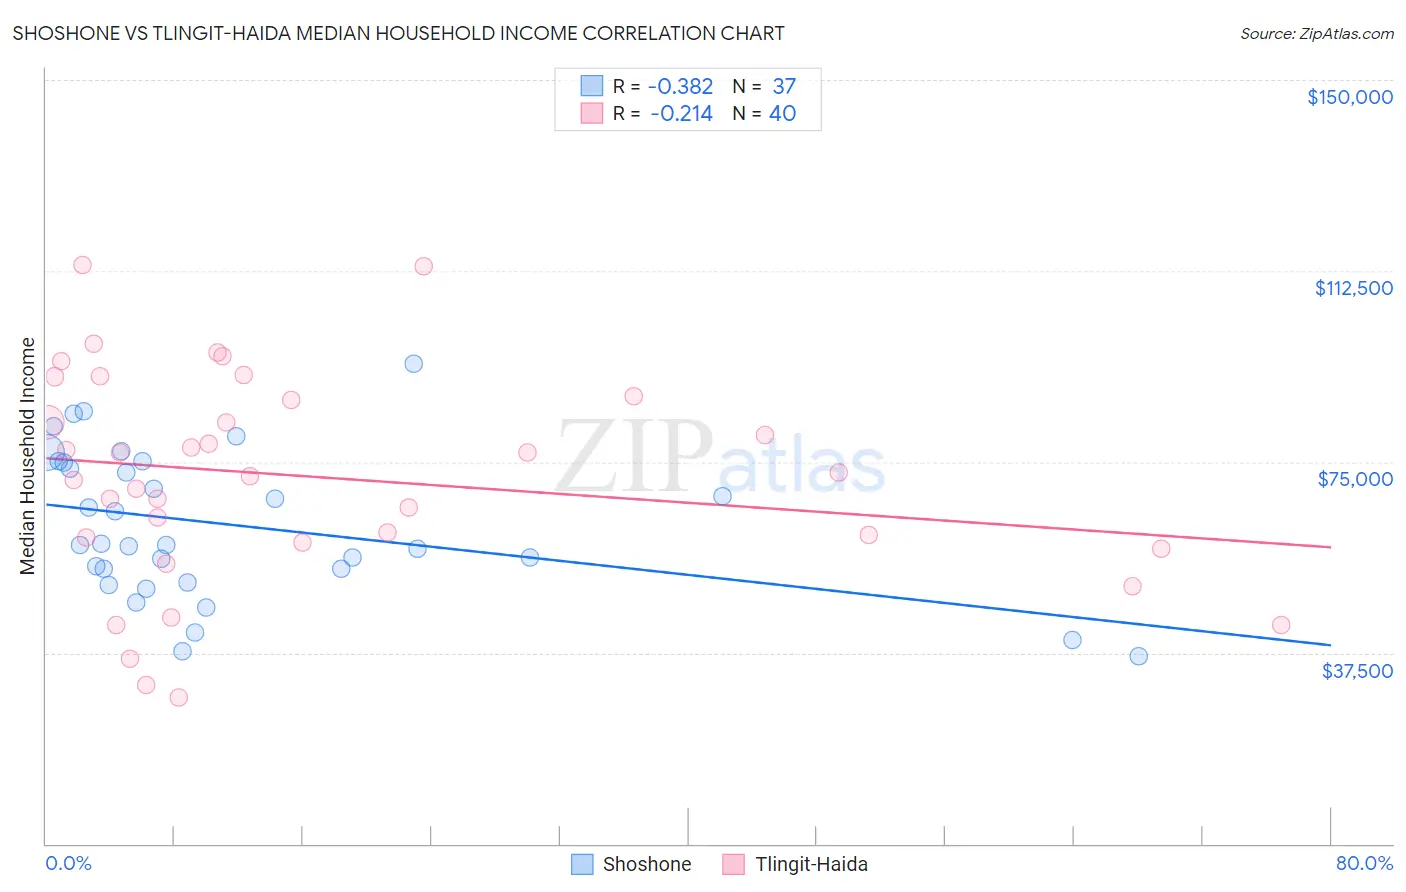
Shoshone vs Tlingit-Haida Median Household Income Correlation Chart
The statistical analysis conducted on geographies consisting of 66,612,449 people shows a mild negative correlation between the proportion of Shoshone and median household income in the United States with a correlation coefficient (R) of -0.382 and weighted average of $72,660. Similarly, the statistical analysis conducted on geographies consisting of 60,854,436 people shows a weak negative correlation between the proportion of Tlingit-Haida and median household income in the United States with a correlation coefficient (R) of -0.214 and weighted average of $83,968, a difference of 15.6%.
Median Household Income Correlation Summary
| Measurement | Shoshone | Tlingit-Haida |
| Minimum | $36,823 | $28,750 |
| Maximum | $94,375 | $113,574 |
| Range | $57,552 | $84,824 |
| Mean | $62,559 | $71,962 |
| Median | $58,750 | $72,542 |
| Interquartile 25% (IQ1) | $52,629 | $59,644 |
| Interquartile 75% (IQ3) | $75,002 | $87,562 |
| Interquartile Range (IQR) | $22,372 | $27,918 |
| Standard Deviation (Sample) | $14,416 | $20,793 |
| Standard Deviation (Population) | $14,219 | $20,531 |
Similar Demographics by Median Household Income
Demographics Similar to Shoshone by Median Household Income
In terms of median household income, the demographic groups most similar to Shoshone are African ($72,650, a difference of 0.010%), Cherokee ($72,682, a difference of 0.030%), Immigrants from Haiti ($72,599, a difference of 0.080%), Honduran ($72,588, a difference of 0.10%), and Potawatomi ($72,576, a difference of 0.12%).
| Demographics | Rating | Rank | Median Household Income |
| Cubans | 0.1 /100 | #295 | Tragic $73,392 |
| Haitians | 0.1 /100 | #296 | Tragic $73,306 |
| Immigrants | Mexico | 0.0 /100 | #297 | Tragic $73,160 |
| Paiute | 0.0 /100 | #298 | Tragic $72,959 |
| Indonesians | 0.0 /100 | #299 | Tragic $72,856 |
| Immigrants | Dominica | 0.0 /100 | #300 | Tragic $72,760 |
| Cherokee | 0.0 /100 | #301 | Tragic $72,682 |
| Shoshone | 0.0 /100 | #302 | Tragic $72,660 |
| Africans | 0.0 /100 | #303 | Tragic $72,650 |
| Immigrants | Haiti | 0.0 /100 | #304 | Tragic $72,599 |
| Hondurans | 0.0 /100 | #305 | Tragic $72,588 |
| Potawatomi | 0.0 /100 | #306 | Tragic $72,576 |
| Ute | 0.0 /100 | #307 | Tragic $72,402 |
| Yakama | 0.0 /100 | #308 | Tragic $72,225 |
| Immigrants | Caribbean | 0.0 /100 | #309 | Tragic $71,860 |
Demographics Similar to Tlingit-Haida by Median Household Income
In terms of median household income, the demographic groups most similar to Tlingit-Haida are Puget Sound Salish ($84,011, a difference of 0.050%), Belgian ($84,008, a difference of 0.050%), Immigrants from Colombia ($83,902, a difference of 0.080%), Kenyan ($84,085, a difference of 0.14%), and Slovak ($83,798, a difference of 0.20%).
| Demographics | Rating | Rank | Median Household Income |
| Hawaiians | 44.1 /100 | #181 | Average $84,729 |
| Uruguayans | 43.5 /100 | #182 | Average $84,691 |
| Spaniards | 42.7 /100 | #183 | Average $84,644 |
| Immigrants | Eastern Africa | 37.4 /100 | #184 | Fair $84,299 |
| Kenyans | 34.2 /100 | #185 | Fair $84,085 |
| Puget Sound Salish | 33.2 /100 | #186 | Fair $84,011 |
| Belgians | 33.2 /100 | #187 | Fair $84,008 |
| Tlingit-Haida | 32.6 /100 | #188 | Fair $83,968 |
| Immigrants | Colombia | 31.7 /100 | #189 | Fair $83,902 |
| Slovaks | 30.2 /100 | #190 | Fair $83,798 |
| Iraqis | 29.6 /100 | #191 | Fair $83,753 |
| Welsh | 28.0 /100 | #192 | Fair $83,628 |
| Finns | 27.7 /100 | #193 | Fair $83,607 |
| Ghanaians | 27.4 /100 | #194 | Fair $83,582 |
| Immigrants | Armenia | 27.0 /100 | #195 | Fair $83,555 |