Alsatian vs Tlingit-Haida Median Household Income
COMPARE
Alsatian
Tlingit-Haida
Median Household Income
Median Household Income Comparison
Alsatians
Tlingit-Haida
$85,053
MEDIAN HOUSEHOLD INCOME
49.2/ 100
METRIC RATING
176th/ 347
METRIC RANK
$83,968
MEDIAN HOUSEHOLD INCOME
32.6/ 100
METRIC RATING
188th/ 347
METRIC RANK
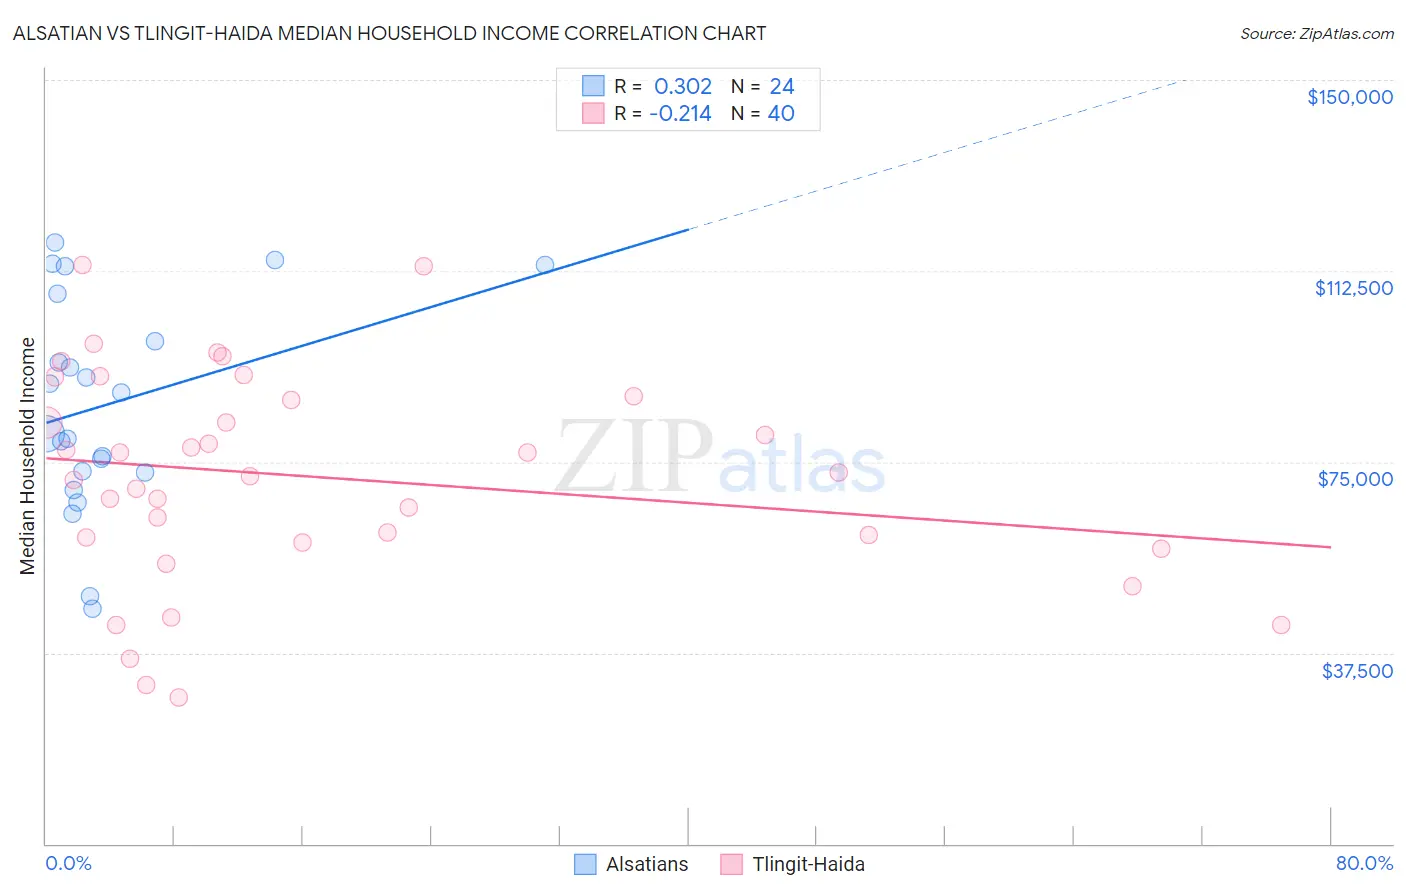
Alsatian vs Tlingit-Haida Median Household Income Correlation Chart
The statistical analysis conducted on geographies consisting of 82,678,631 people shows a mild positive correlation between the proportion of Alsatians and median household income in the United States with a correlation coefficient (R) of 0.302 and weighted average of $85,053. Similarly, the statistical analysis conducted on geographies consisting of 60,854,436 people shows a weak negative correlation between the proportion of Tlingit-Haida and median household income in the United States with a correlation coefficient (R) of -0.214 and weighted average of $83,968, a difference of 1.3%.
Median Household Income Correlation Summary
| Measurement | Alsatian | Tlingit-Haida |
| Minimum | $46,250 | $28,750 |
| Maximum | $118,135 | $113,574 |
| Range | $71,885 | $84,824 |
| Mean | $86,339 | $71,962 |
| Median | $84,486 | $72,542 |
| Interquartile 25% (IQ1) | $73,000 | $59,644 |
| Interquartile 75% (IQ3) | $103,435 | $87,562 |
| Interquartile Range (IQR) | $30,436 | $27,918 |
| Standard Deviation (Sample) | $20,538 | $20,793 |
| Standard Deviation (Population) | $20,105 | $20,531 |
Demographics Similar to Alsatians and Tlingit-Haida by Median Household Income
In terms of median household income, the demographic groups most similar to Alsatians are Immigrants from Costa Rica ($85,054, a difference of 0.0%), Immigrants from Eritrea ($85,025, a difference of 0.030%), Scottish ($85,101, a difference of 0.060%), Czechoslovakian ($84,965, a difference of 0.10%), and English ($84,915, a difference of 0.16%). Similarly, the demographic groups most similar to Tlingit-Haida are Puget Sound Salish ($84,011, a difference of 0.050%), Belgian ($84,008, a difference of 0.050%), Immigrants from Colombia ($83,902, a difference of 0.080%), Kenyan ($84,085, a difference of 0.14%), and Slovak ($83,798, a difference of 0.20%).
| Demographics | Rating | Rank | Median Household Income |
| Slovenes | 57.4 /100 | #172 | Average $85,562 |
| Immigrants | Cameroon | 53.4 /100 | #173 | Average $85,314 |
| Scottish | 50.0 /100 | #174 | Average $85,101 |
| Immigrants | Costa Rica | 49.2 /100 | #175 | Average $85,054 |
| Alsatians | 49.2 /100 | #176 | Average $85,053 |
| Immigrants | Eritrea | 48.8 /100 | #177 | Average $85,025 |
| Czechoslovakians | 47.8 /100 | #178 | Average $84,965 |
| English | 47.0 /100 | #179 | Average $84,915 |
| Immigrants | Portugal | 44.2 /100 | #180 | Average $84,740 |
| Hawaiians | 44.1 /100 | #181 | Average $84,729 |
| Uruguayans | 43.5 /100 | #182 | Average $84,691 |
| Spaniards | 42.7 /100 | #183 | Average $84,644 |
| Immigrants | Eastern Africa | 37.4 /100 | #184 | Fair $84,299 |
| Kenyans | 34.2 /100 | #185 | Fair $84,085 |
| Puget Sound Salish | 33.2 /100 | #186 | Fair $84,011 |
| Belgians | 33.2 /100 | #187 | Fair $84,008 |
| Tlingit-Haida | 32.6 /100 | #188 | Fair $83,968 |
| Immigrants | Colombia | 31.7 /100 | #189 | Fair $83,902 |
| Slovaks | 30.2 /100 | #190 | Fair $83,798 |
| Iraqis | 29.6 /100 | #191 | Fair $83,753 |
| Welsh | 28.0 /100 | #192 | Fair $83,628 |