Shoshone vs Iranian Median Household Income
COMPARE
Shoshone
Iranian
Median Household Income
Median Household Income Comparison
Shoshone
Iranians
$72,660
MEDIAN HOUSEHOLD INCOME
0.0/ 100
METRIC RATING
302nd/ 347
METRIC RANK
$109,835
MEDIAN HOUSEHOLD INCOME
100.0/ 100
METRIC RATING
7th/ 347
METRIC RANK
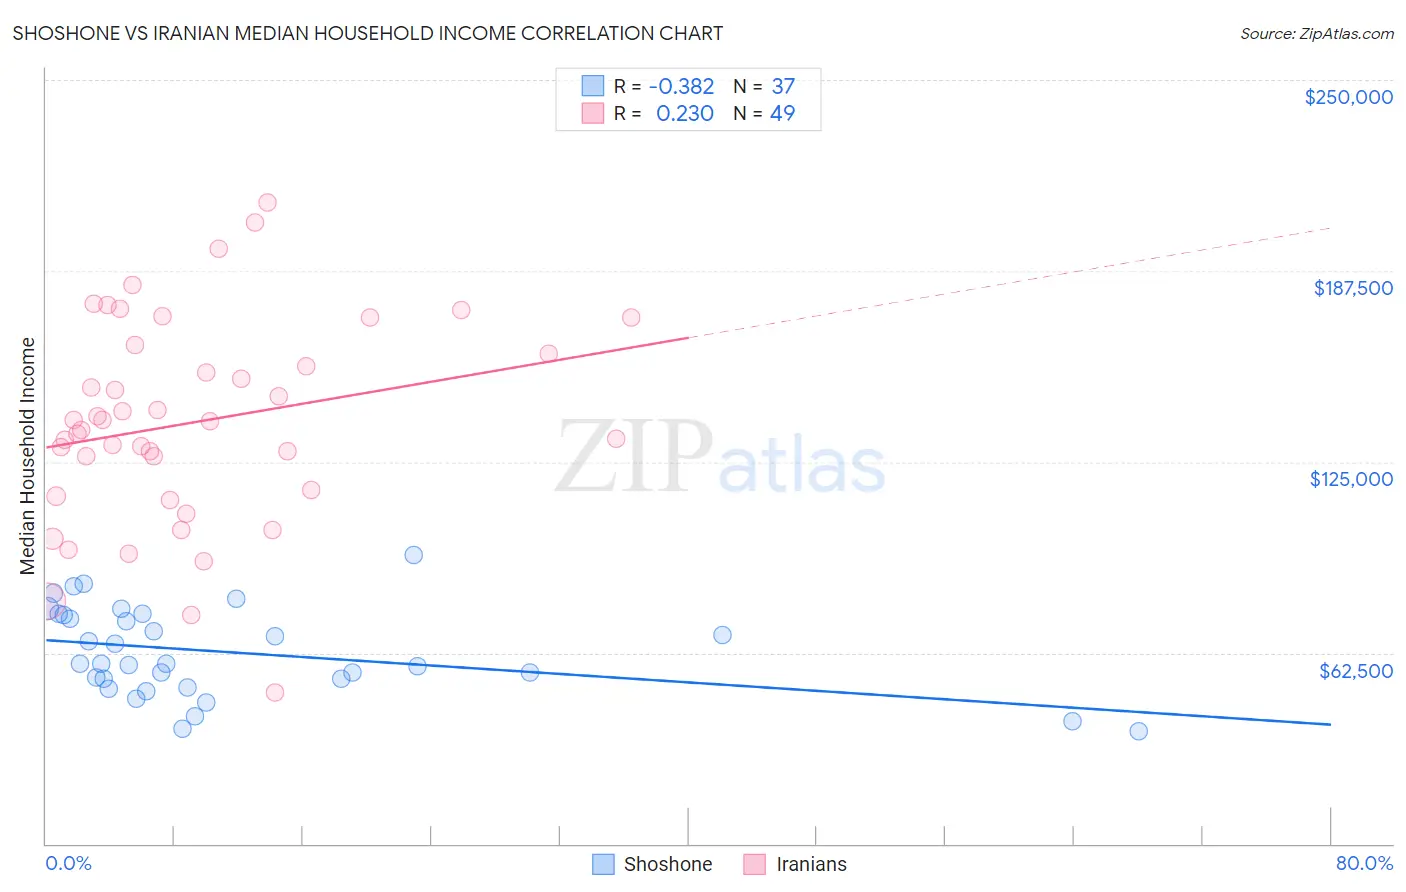
Shoshone vs Iranian Median Household Income Correlation Chart
The statistical analysis conducted on geographies consisting of 66,612,449 people shows a mild negative correlation between the proportion of Shoshone and median household income in the United States with a correlation coefficient (R) of -0.382 and weighted average of $72,660. Similarly, the statistical analysis conducted on geographies consisting of 316,594,709 people shows a weak positive correlation between the proportion of Iranians and median household income in the United States with a correlation coefficient (R) of 0.230 and weighted average of $109,835, a difference of 51.2%.
Median Household Income Correlation Summary
| Measurement | Shoshone | Iranian |
| Minimum | $36,823 | $49,583 |
| Maximum | $94,375 | $210,000 |
| Range | $57,552 | $160,417 |
| Mean | $62,559 | $137,928 |
| Median | $58,750 | $138,452 |
| Interquartile 25% (IQ1) | $52,629 | $114,688 |
| Interquartile 75% (IQ3) | $75,002 | $161,748 |
| Interquartile Range (IQR) | $22,372 | $47,060 |
| Standard Deviation (Sample) | $14,416 | $33,663 |
| Standard Deviation (Population) | $14,219 | $33,318 |
Similar Demographics by Median Household Income
Demographics Similar to Shoshone by Median Household Income
In terms of median household income, the demographic groups most similar to Shoshone are African ($72,650, a difference of 0.010%), Cherokee ($72,682, a difference of 0.030%), Immigrants from Haiti ($72,599, a difference of 0.080%), Honduran ($72,588, a difference of 0.10%), and Potawatomi ($72,576, a difference of 0.12%).
| Demographics | Rating | Rank | Median Household Income |
| Cubans | 0.1 /100 | #295 | Tragic $73,392 |
| Haitians | 0.1 /100 | #296 | Tragic $73,306 |
| Immigrants | Mexico | 0.0 /100 | #297 | Tragic $73,160 |
| Paiute | 0.0 /100 | #298 | Tragic $72,959 |
| Indonesians | 0.0 /100 | #299 | Tragic $72,856 |
| Immigrants | Dominica | 0.0 /100 | #300 | Tragic $72,760 |
| Cherokee | 0.0 /100 | #301 | Tragic $72,682 |
| Shoshone | 0.0 /100 | #302 | Tragic $72,660 |
| Africans | 0.0 /100 | #303 | Tragic $72,650 |
| Immigrants | Haiti | 0.0 /100 | #304 | Tragic $72,599 |
| Hondurans | 0.0 /100 | #305 | Tragic $72,588 |
| Potawatomi | 0.0 /100 | #306 | Tragic $72,576 |
| Ute | 0.0 /100 | #307 | Tragic $72,402 |
| Yakama | 0.0 /100 | #308 | Tragic $72,225 |
| Immigrants | Caribbean | 0.0 /100 | #309 | Tragic $71,860 |
Demographics Similar to Iranians by Median Household Income
In terms of median household income, the demographic groups most similar to Iranians are Immigrants from Singapore ($110,428, a difference of 0.54%), Thai ($110,648, a difference of 0.74%), Immigrants from Hong Kong ($111,519, a difference of 1.5%), Immigrants from Iran ($108,055, a difference of 1.7%), and Immigrants from India ($113,009, a difference of 2.9%).
| Demographics | Rating | Rank | Median Household Income |
| Immigrants | Taiwan | 100.0 /100 | #1 | Exceptional $116,460 |
| Filipinos | 100.0 /100 | #2 | Exceptional $115,509 |
| Immigrants | India | 100.0 /100 | #3 | Exceptional $113,009 |
| Immigrants | Hong Kong | 100.0 /100 | #4 | Exceptional $111,519 |
| Thais | 100.0 /100 | #5 | Exceptional $110,648 |
| Immigrants | Singapore | 100.0 /100 | #6 | Exceptional $110,428 |
| Iranians | 100.0 /100 | #7 | Exceptional $109,835 |
| Immigrants | Iran | 100.0 /100 | #8 | Exceptional $108,055 |
| Okinawans | 100.0 /100 | #9 | Exceptional $106,624 |
| Immigrants | South Central Asia | 100.0 /100 | #10 | Exceptional $106,057 |
| Immigrants | China | 100.0 /100 | #11 | Exceptional $105,335 |
| Indians (Asian) | 100.0 /100 | #12 | Exceptional $105,262 |
| Immigrants | Eastern Asia | 100.0 /100 | #13 | Exceptional $104,796 |
| Immigrants | Ireland | 100.0 /100 | #14 | Exceptional $104,692 |
| Immigrants | Israel | 100.0 /100 | #15 | Exceptional $104,090 |