Immigrants from Sierra Leone vs Tlingit-Haida Median Household Income
COMPARE
Immigrants from Sierra Leone
Tlingit-Haida
Median Household Income
Median Household Income Comparison
Immigrants from Sierra Leone
Tlingit-Haida
$88,498
MEDIAN HOUSEHOLD INCOME
89.9/ 100
METRIC RATING
135th/ 347
METRIC RANK
$83,968
MEDIAN HOUSEHOLD INCOME
32.6/ 100
METRIC RATING
188th/ 347
METRIC RANK
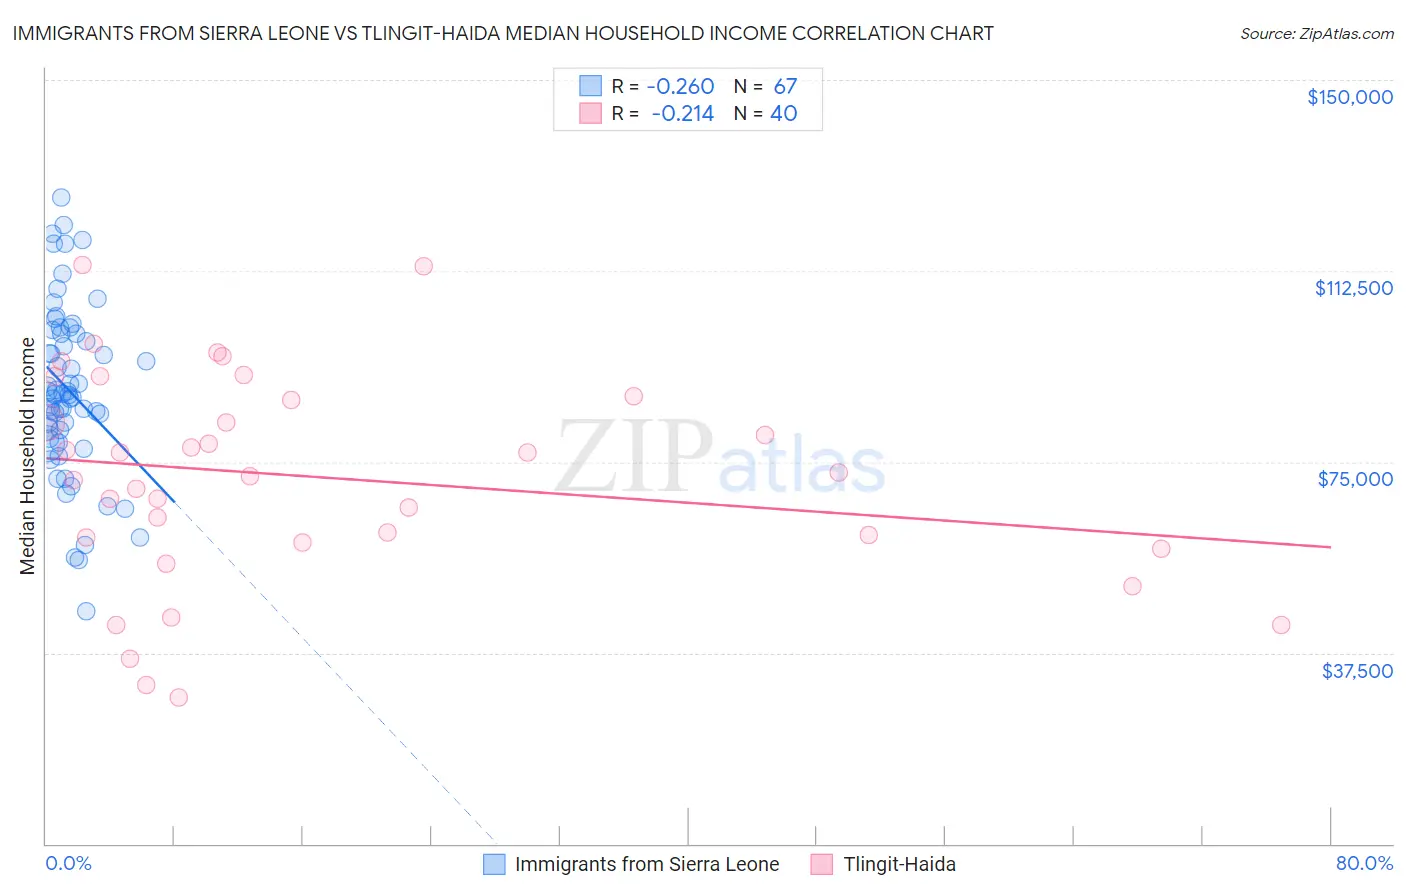
Immigrants from Sierra Leone vs Tlingit-Haida Median Household Income Correlation Chart
The statistical analysis conducted on geographies consisting of 101,642,850 people shows a weak negative correlation between the proportion of Immigrants from Sierra Leone and median household income in the United States with a correlation coefficient (R) of -0.260 and weighted average of $88,498. Similarly, the statistical analysis conducted on geographies consisting of 60,854,436 people shows a weak negative correlation between the proportion of Tlingit-Haida and median household income in the United States with a correlation coefficient (R) of -0.214 and weighted average of $83,968, a difference of 5.4%.
Median Household Income Correlation Summary
| Measurement | Immigrants from Sierra Leone | Tlingit-Haida |
| Minimum | $45,542 | $28,750 |
| Maximum | $126,910 | $113,574 |
| Range | $81,369 | $84,824 |
| Mean | $89,050 | $71,962 |
| Median | $88,269 | $72,542 |
| Interquartile 25% (IQ1) | $79,610 | $59,644 |
| Interquartile 75% (IQ3) | $100,223 | $87,562 |
| Interquartile Range (IQR) | $20,614 | $27,918 |
| Standard Deviation (Sample) | $16,774 | $20,793 |
| Standard Deviation (Population) | $16,648 | $20,531 |
Similar Demographics by Median Household Income
Demographics Similar to Immigrants from Sierra Leone by Median Household Income
In terms of median household income, the demographic groups most similar to Immigrants from Sierra Leone are Swedish ($88,524, a difference of 0.030%), Polish ($88,472, a difference of 0.030%), Sierra Leonean ($88,463, a difference of 0.040%), Arab ($88,398, a difference of 0.11%), and Immigrants from Chile ($88,388, a difference of 0.12%).
| Demographics | Rating | Rank | Median Household Income |
| Portuguese | 92.3 /100 | #128 | Exceptional $88,976 |
| Brazilians | 92.1 /100 | #129 | Exceptional $88,934 |
| British | 92.0 /100 | #130 | Exceptional $88,914 |
| Immigrants | Syria | 91.4 /100 | #131 | Exceptional $88,792 |
| Europeans | 91.2 /100 | #132 | Exceptional $88,751 |
| Immigrants | Ethiopia | 90.9 /100 | #133 | Exceptional $88,687 |
| Swedes | 90.0 /100 | #134 | Exceptional $88,524 |
| Immigrants | Sierra Leone | 89.9 /100 | #135 | Excellent $88,498 |
| Poles | 89.7 /100 | #136 | Excellent $88,472 |
| Sierra Leoneans | 89.6 /100 | #137 | Excellent $88,463 |
| Arabs | 89.2 /100 | #138 | Excellent $88,398 |
| Immigrants | Chile | 89.2 /100 | #139 | Excellent $88,388 |
| Lebanese | 87.2 /100 | #140 | Excellent $88,091 |
| Immigrants | Morocco | 86.0 /100 | #141 | Excellent $87,930 |
| Canadians | 84.7 /100 | #142 | Excellent $87,769 |
Demographics Similar to Tlingit-Haida by Median Household Income
In terms of median household income, the demographic groups most similar to Tlingit-Haida are Puget Sound Salish ($84,011, a difference of 0.050%), Belgian ($84,008, a difference of 0.050%), Immigrants from Colombia ($83,902, a difference of 0.080%), Kenyan ($84,085, a difference of 0.14%), and Slovak ($83,798, a difference of 0.20%).
| Demographics | Rating | Rank | Median Household Income |
| Hawaiians | 44.1 /100 | #181 | Average $84,729 |
| Uruguayans | 43.5 /100 | #182 | Average $84,691 |
| Spaniards | 42.7 /100 | #183 | Average $84,644 |
| Immigrants | Eastern Africa | 37.4 /100 | #184 | Fair $84,299 |
| Kenyans | 34.2 /100 | #185 | Fair $84,085 |
| Puget Sound Salish | 33.2 /100 | #186 | Fair $84,011 |
| Belgians | 33.2 /100 | #187 | Fair $84,008 |
| Tlingit-Haida | 32.6 /100 | #188 | Fair $83,968 |
| Immigrants | Colombia | 31.7 /100 | #189 | Fair $83,902 |
| Slovaks | 30.2 /100 | #190 | Fair $83,798 |
| Iraqis | 29.6 /100 | #191 | Fair $83,753 |
| Welsh | 28.0 /100 | #192 | Fair $83,628 |
| Finns | 27.7 /100 | #193 | Fair $83,607 |
| Ghanaians | 27.4 /100 | #194 | Fair $83,582 |
| Immigrants | Armenia | 27.0 /100 | #195 | Fair $83,555 |