Shoshone vs Immigrants from Jamaica Median Female Earnings
COMPARE
Shoshone
Immigrants from Jamaica
Median Female Earnings
Median Female Earnings Comparison
Shoshone
Immigrants from Jamaica
$34,677
MEDIAN FEMALE EARNINGS
0.0/ 100
METRIC RATING
319th/ 347
METRIC RANK
$38,625
MEDIAN FEMALE EARNINGS
9.7/ 100
METRIC RATING
217th/ 347
METRIC RANK
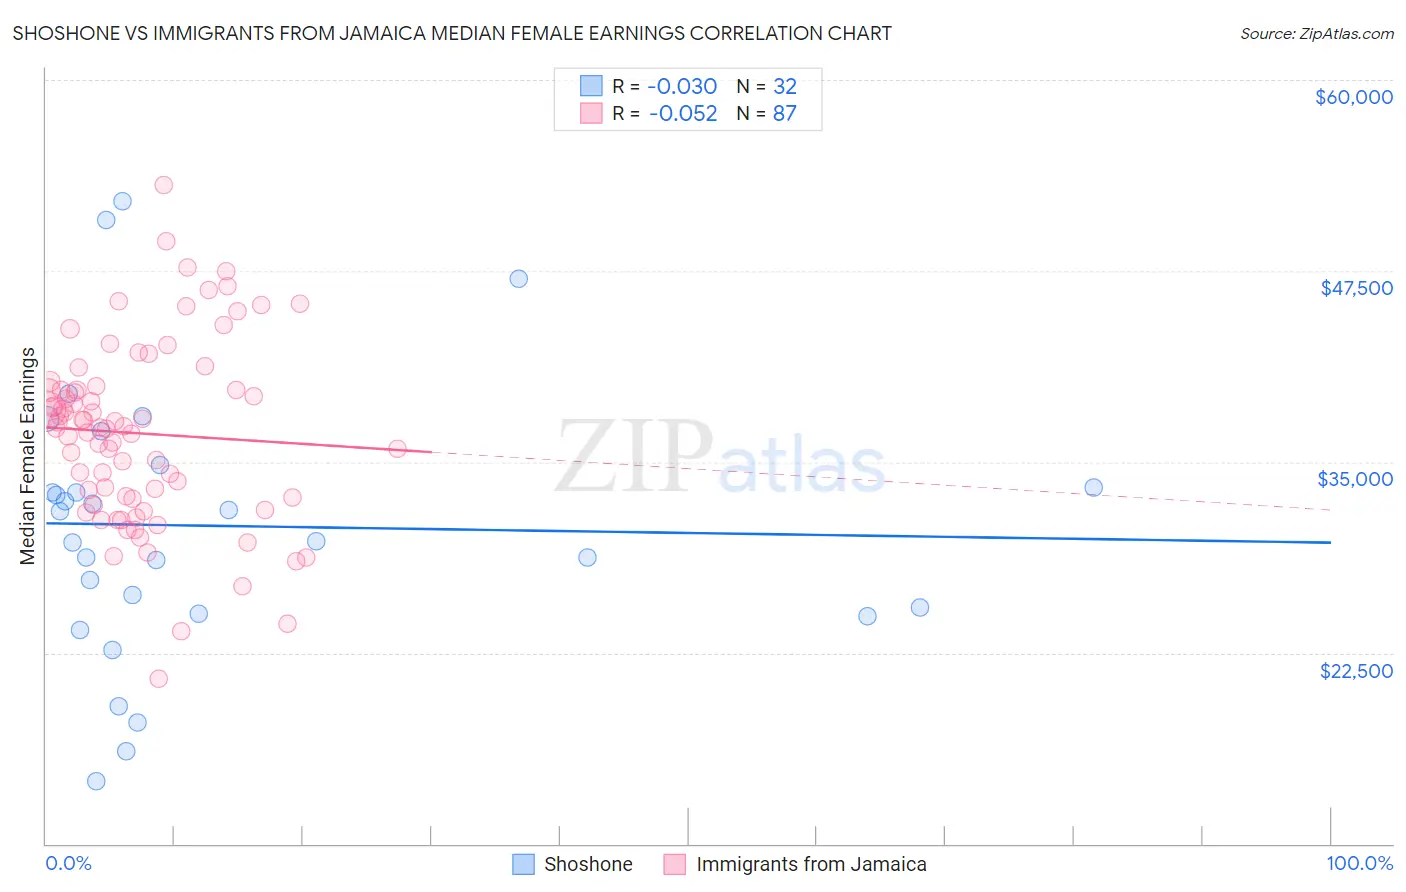
Shoshone vs Immigrants from Jamaica Median Female Earnings Correlation Chart
The statistical analysis conducted on geographies consisting of 66,610,433 people shows no correlation between the proportion of Shoshone and median female earnings in the United States with a correlation coefficient (R) of -0.030 and weighted average of $34,677. Similarly, the statistical analysis conducted on geographies consisting of 301,720,032 people shows a slight negative correlation between the proportion of Immigrants from Jamaica and median female earnings in the United States with a correlation coefficient (R) of -0.052 and weighted average of $38,625, a difference of 11.4%.
Median Female Earnings Correlation Summary
| Measurement | Shoshone | Immigrants from Jamaica |
| Minimum | $14,091 | $20,815 |
| Maximum | $52,089 | $53,086 |
| Range | $37,998 | $32,271 |
| Mean | $30,807 | $36,867 |
| Median | $30,799 | $37,264 |
| Interquartile 25% (IQ1) | $25,287 | $32,574 |
| Interquartile 75% (IQ3) | $34,049 | $39,745 |
| Interquartile Range (IQR) | $8,762 | $7,171 |
| Standard Deviation (Sample) | $8,852 | $5,965 |
| Standard Deviation (Population) | $8,713 | $5,931 |
Similar Demographics by Median Female Earnings
Demographics Similar to Shoshone by Median Female Earnings
In terms of median female earnings, the demographic groups most similar to Shoshone are Immigrants from Yemen ($34,693, a difference of 0.050%), Immigrants from Honduras ($34,647, a difference of 0.090%), Potawatomi ($34,739, a difference of 0.18%), Cherokee ($34,742, a difference of 0.19%), and Pennsylvania German ($34,802, a difference of 0.36%).
| Demographics | Rating | Rank | Median Female Earnings |
| Yaqui | 0.0 /100 | #312 | Tragic $34,943 |
| Cubans | 0.0 /100 | #313 | Tragic $34,942 |
| Apache | 0.0 /100 | #314 | Tragic $34,895 |
| Pennsylvania Germans | 0.0 /100 | #315 | Tragic $34,802 |
| Cherokee | 0.0 /100 | #316 | Tragic $34,742 |
| Potawatomi | 0.0 /100 | #317 | Tragic $34,739 |
| Immigrants | Yemen | 0.0 /100 | #318 | Tragic $34,693 |
| Shoshone | 0.0 /100 | #319 | Tragic $34,677 |
| Immigrants | Honduras | 0.0 /100 | #320 | Tragic $34,647 |
| Hispanics or Latinos | 0.0 /100 | #321 | Tragic $34,421 |
| Chickasaw | 0.0 /100 | #322 | Tragic $34,414 |
| Seminole | 0.0 /100 | #323 | Tragic $34,385 |
| Immigrants | Congo | 0.0 /100 | #324 | Tragic $34,317 |
| Dutch West Indians | 0.0 /100 | #325 | Tragic $34,106 |
| Kiowa | 0.0 /100 | #326 | Tragic $34,074 |
Demographics Similar to Immigrants from Jamaica by Median Female Earnings
In terms of median female earnings, the demographic groups most similar to Immigrants from Jamaica are Cape Verdean ($38,614, a difference of 0.030%), Immigrants from Ecuador ($38,644, a difference of 0.050%), Nepalese ($38,603, a difference of 0.060%), Spaniard ($38,656, a difference of 0.080%), and Iraqi ($38,666, a difference of 0.11%).
| Demographics | Rating | Rank | Median Female Earnings |
| Czechoslovakians | 12.0 /100 | #210 | Poor $38,738 |
| Aleuts | 11.6 /100 | #211 | Poor $38,719 |
| Guamanians/Chamorros | 11.5 /100 | #212 | Poor $38,717 |
| Jamaicans | 10.5 /100 | #213 | Poor $38,670 |
| Iraqis | 10.5 /100 | #214 | Poor $38,666 |
| Spaniards | 10.3 /100 | #215 | Poor $38,656 |
| Immigrants | Ecuador | 10.1 /100 | #216 | Poor $38,644 |
| Immigrants | Jamaica | 9.7 /100 | #217 | Tragic $38,625 |
| Cape Verdeans | 9.5 /100 | #218 | Tragic $38,614 |
| Nepalese | 9.3 /100 | #219 | Tragic $38,603 |
| Yugoslavians | 8.8 /100 | #220 | Tragic $38,573 |
| Immigrants | Azores | 8.8 /100 | #221 | Tragic $38,573 |
| Japanese | 8.1 /100 | #222 | Tragic $38,528 |
| Immigrants | Sudan | 7.8 /100 | #223 | Tragic $38,511 |
| Native Hawaiians | 7.1 /100 | #224 | Tragic $38,461 |