Shoshone vs Czechoslovakian Median Female Earnings
COMPARE
Shoshone
Czechoslovakian
Median Female Earnings
Median Female Earnings Comparison
Shoshone
Czechoslovakians
$34,677
MEDIAN FEMALE EARNINGS
0.0/ 100
METRIC RATING
319th/ 347
METRIC RANK
$38,738
MEDIAN FEMALE EARNINGS
12.0/ 100
METRIC RATING
210th/ 347
METRIC RANK
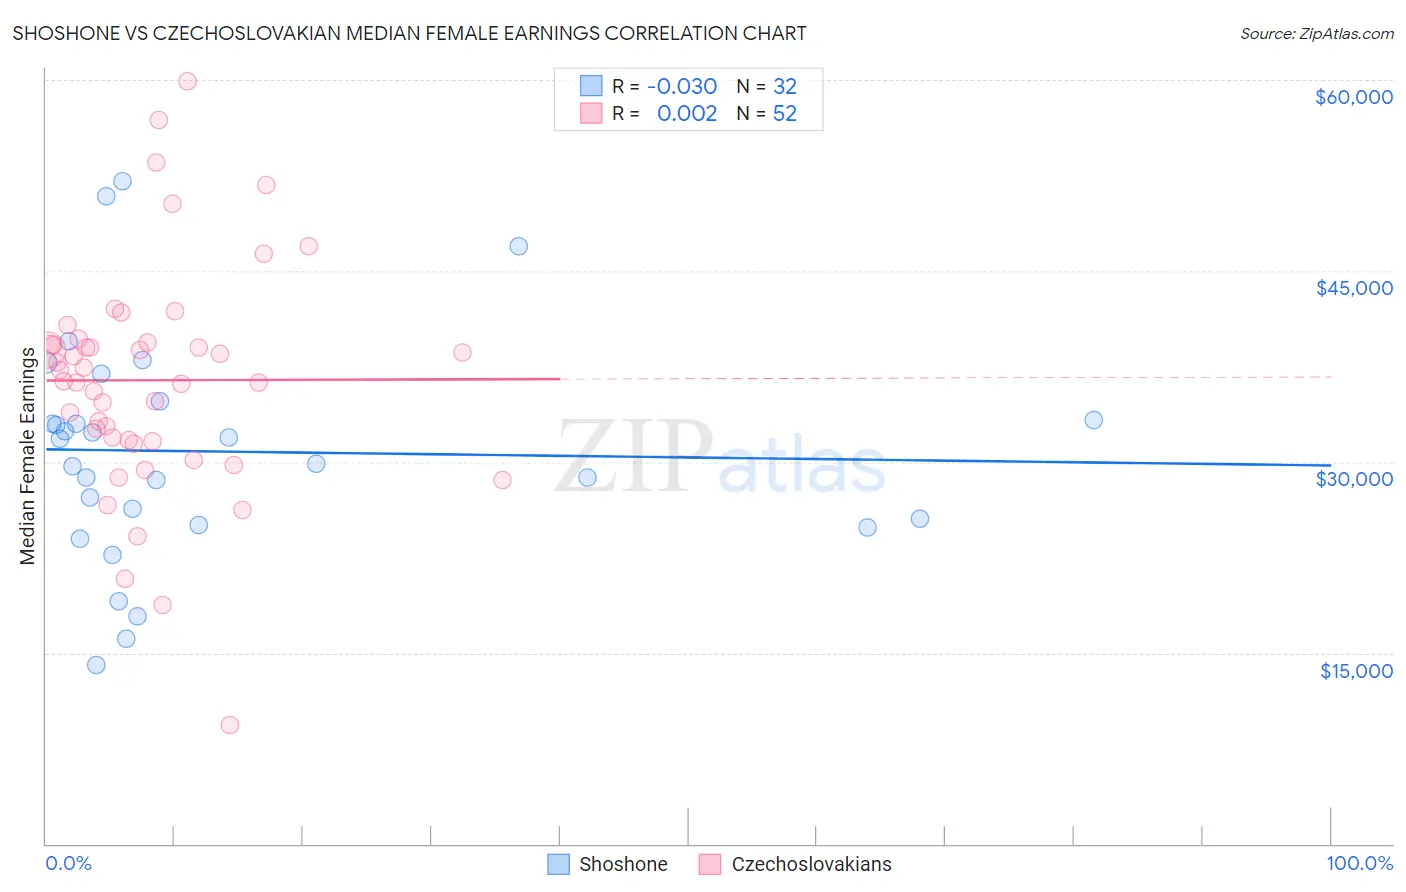
Shoshone vs Czechoslovakian Median Female Earnings Correlation Chart
The statistical analysis conducted on geographies consisting of 66,610,433 people shows no correlation between the proportion of Shoshone and median female earnings in the United States with a correlation coefficient (R) of -0.030 and weighted average of $34,677. Similarly, the statistical analysis conducted on geographies consisting of 368,499,928 people shows no correlation between the proportion of Czechoslovakians and median female earnings in the United States with a correlation coefficient (R) of 0.002 and weighted average of $38,738, a difference of 11.7%.
Median Female Earnings Correlation Summary
| Measurement | Shoshone | Czechoslovakian |
| Minimum | $14,091 | $9,297 |
| Maximum | $52,089 | $59,868 |
| Range | $37,998 | $50,571 |
| Mean | $30,807 | $36,417 |
| Median | $30,799 | $36,782 |
| Interquartile 25% (IQ1) | $25,287 | $31,695 |
| Interquartile 75% (IQ3) | $34,049 | $39,301 |
| Interquartile Range (IQR) | $8,762 | $7,606 |
| Standard Deviation (Sample) | $8,852 | $8,994 |
| Standard Deviation (Population) | $8,713 | $8,907 |
Similar Demographics by Median Female Earnings
Demographics Similar to Shoshone by Median Female Earnings
In terms of median female earnings, the demographic groups most similar to Shoshone are Immigrants from Yemen ($34,693, a difference of 0.050%), Immigrants from Honduras ($34,647, a difference of 0.090%), Potawatomi ($34,739, a difference of 0.18%), Cherokee ($34,742, a difference of 0.19%), and Pennsylvania German ($34,802, a difference of 0.36%).
| Demographics | Rating | Rank | Median Female Earnings |
| Yaqui | 0.0 /100 | #312 | Tragic $34,943 |
| Cubans | 0.0 /100 | #313 | Tragic $34,942 |
| Apache | 0.0 /100 | #314 | Tragic $34,895 |
| Pennsylvania Germans | 0.0 /100 | #315 | Tragic $34,802 |
| Cherokee | 0.0 /100 | #316 | Tragic $34,742 |
| Potawatomi | 0.0 /100 | #317 | Tragic $34,739 |
| Immigrants | Yemen | 0.0 /100 | #318 | Tragic $34,693 |
| Shoshone | 0.0 /100 | #319 | Tragic $34,677 |
| Immigrants | Honduras | 0.0 /100 | #320 | Tragic $34,647 |
| Hispanics or Latinos | 0.0 /100 | #321 | Tragic $34,421 |
| Chickasaw | 0.0 /100 | #322 | Tragic $34,414 |
| Seminole | 0.0 /100 | #323 | Tragic $34,385 |
| Immigrants | Congo | 0.0 /100 | #324 | Tragic $34,317 |
| Dutch West Indians | 0.0 /100 | #325 | Tragic $34,106 |
| Kiowa | 0.0 /100 | #326 | Tragic $34,074 |
Demographics Similar to Czechoslovakians by Median Female Earnings
In terms of median female earnings, the demographic groups most similar to Czechoslovakians are Aleut ($38,719, a difference of 0.050%), Guamanian/Chamorro ($38,717, a difference of 0.050%), Norwegian ($38,802, a difference of 0.17%), Jamaican ($38,670, a difference of 0.18%), and Immigrants from Thailand ($38,810, a difference of 0.19%).
| Demographics | Rating | Rank | Median Female Earnings |
| Czechs | 18.7 /100 | #203 | Poor $38,992 |
| Immigrants | Uruguay | 17.3 /100 | #204 | Poor $38,945 |
| Immigrants | Colombia | 16.3 /100 | #205 | Poor $38,913 |
| Immigrants | Bosnia and Herzegovina | 15.6 /100 | #206 | Poor $38,886 |
| Immigrants | Cambodia | 14.2 /100 | #207 | Poor $38,833 |
| Immigrants | Thailand | 13.6 /100 | #208 | Poor $38,810 |
| Norwegians | 13.4 /100 | #209 | Poor $38,802 |
| Czechoslovakians | 12.0 /100 | #210 | Poor $38,738 |
| Aleuts | 11.6 /100 | #211 | Poor $38,719 |
| Guamanians/Chamorros | 11.5 /100 | #212 | Poor $38,717 |
| Jamaicans | 10.5 /100 | #213 | Poor $38,670 |
| Iraqis | 10.5 /100 | #214 | Poor $38,666 |
| Spaniards | 10.3 /100 | #215 | Poor $38,656 |
| Immigrants | Ecuador | 10.1 /100 | #216 | Poor $38,644 |
| Immigrants | Jamaica | 9.7 /100 | #217 | Tragic $38,625 |