Immigrants from Belgium vs Immigrants from Jamaica Median Female Earnings
COMPARE
Immigrants from Belgium
Immigrants from Jamaica
Median Female Earnings
Median Female Earnings Comparison
Immigrants from Belgium
Immigrants from Jamaica
$44,587
MEDIAN FEMALE EARNINGS
100.0/ 100
METRIC RATING
29th/ 347
METRIC RANK
$38,625
MEDIAN FEMALE EARNINGS
9.7/ 100
METRIC RATING
217th/ 347
METRIC RANK
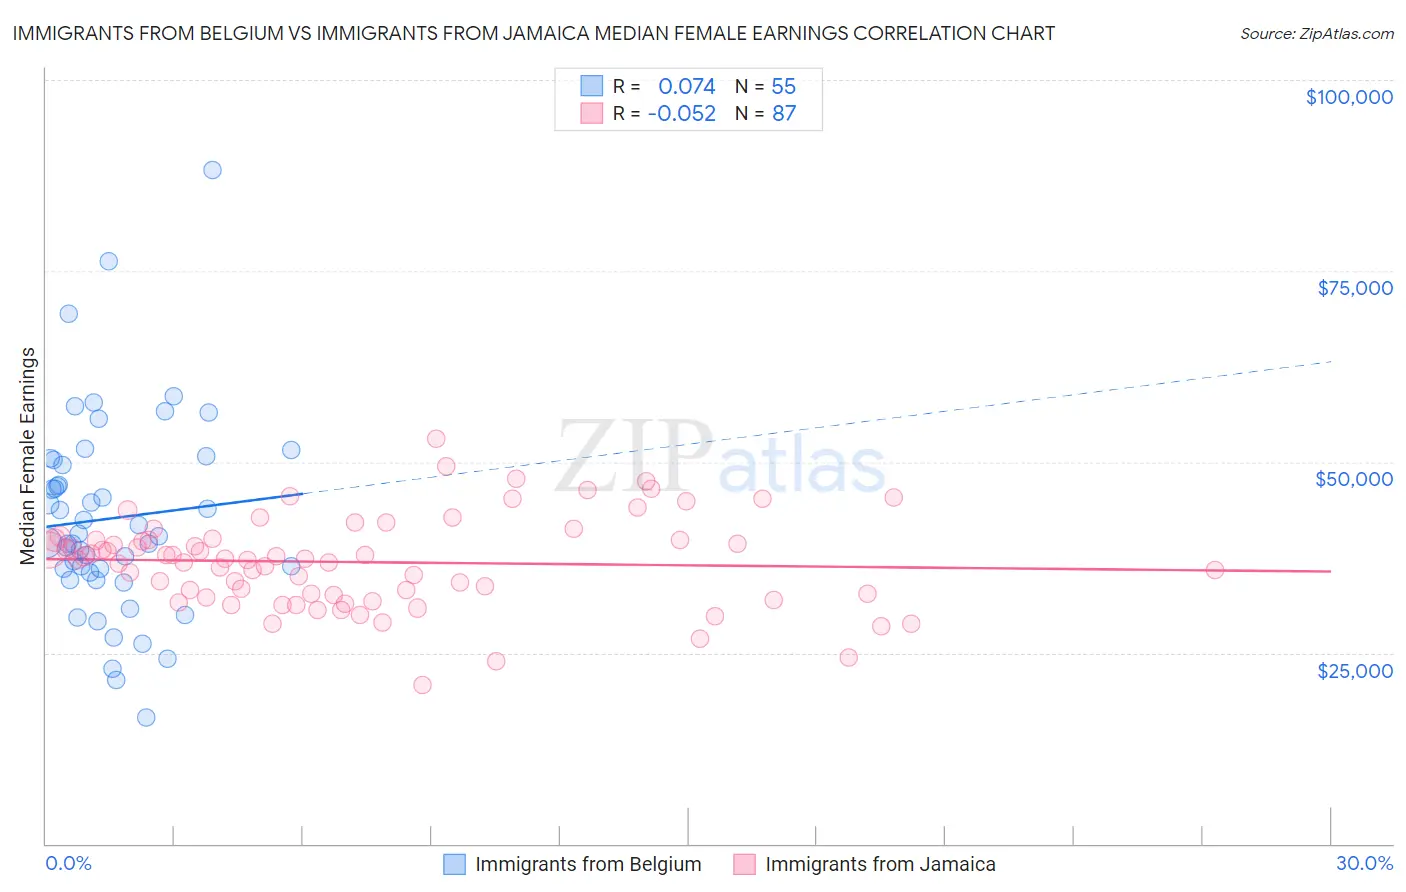
Immigrants from Belgium vs Immigrants from Jamaica Median Female Earnings Correlation Chart
The statistical analysis conducted on geographies consisting of 146,688,407 people shows a slight positive correlation between the proportion of Immigrants from Belgium and median female earnings in the United States with a correlation coefficient (R) of 0.074 and weighted average of $44,587. Similarly, the statistical analysis conducted on geographies consisting of 301,720,032 people shows a slight negative correlation between the proportion of Immigrants from Jamaica and median female earnings in the United States with a correlation coefficient (R) of -0.052 and weighted average of $38,625, a difference of 15.4%.
Median Female Earnings Correlation Summary
| Measurement | Immigrants from Belgium | Immigrants from Jamaica |
| Minimum | $16,513 | $20,815 |
| Maximum | $88,194 | $53,086 |
| Range | $71,681 | $32,271 |
| Mean | $42,604 | $36,867 |
| Median | $40,333 | $37,264 |
| Interquartile 25% (IQ1) | $35,589 | $32,574 |
| Interquartile 75% (IQ3) | $50,235 | $39,745 |
| Interquartile Range (IQR) | $14,647 | $7,171 |
| Standard Deviation (Sample) | $13,110 | $5,965 |
| Standard Deviation (Population) | $12,990 | $5,931 |
Similar Demographics by Median Female Earnings
Demographics Similar to Immigrants from Belgium by Median Female Earnings
In terms of median female earnings, the demographic groups most similar to Immigrants from Belgium are Asian ($44,586, a difference of 0.0%), Immigrants from France ($44,541, a difference of 0.10%), Immigrants from Russia ($44,680, a difference of 0.21%), Turkish ($44,695, a difference of 0.24%), and Immigrants from Belarus ($44,757, a difference of 0.38%).
| Demographics | Rating | Rank | Median Female Earnings |
| Immigrants | Greece | 100.0 /100 | #22 | Exceptional $44,976 |
| Burmese | 100.0 /100 | #23 | Exceptional $44,911 |
| Immigrants | Korea | 100.0 /100 | #24 | Exceptional $44,847 |
| Immigrants | Sweden | 100.0 /100 | #25 | Exceptional $44,774 |
| Immigrants | Belarus | 100.0 /100 | #26 | Exceptional $44,757 |
| Turks | 100.0 /100 | #27 | Exceptional $44,695 |
| Immigrants | Russia | 100.0 /100 | #28 | Exceptional $44,680 |
| Immigrants | Belgium | 100.0 /100 | #29 | Exceptional $44,587 |
| Asians | 100.0 /100 | #30 | Exceptional $44,586 |
| Immigrants | France | 100.0 /100 | #31 | Exceptional $44,541 |
| Immigrants | Northern Europe | 100.0 /100 | #32 | Exceptional $44,366 |
| Immigrants | Asia | 100.0 /100 | #33 | Exceptional $44,198 |
| Russians | 100.0 /100 | #34 | Exceptional $44,169 |
| Immigrants | Sri Lanka | 100.0 /100 | #35 | Exceptional $44,161 |
| Immigrants | Turkey | 100.0 /100 | #36 | Exceptional $44,066 |
Demographics Similar to Immigrants from Jamaica by Median Female Earnings
In terms of median female earnings, the demographic groups most similar to Immigrants from Jamaica are Cape Verdean ($38,614, a difference of 0.030%), Immigrants from Ecuador ($38,644, a difference of 0.050%), Nepalese ($38,603, a difference of 0.060%), Spaniard ($38,656, a difference of 0.080%), and Iraqi ($38,666, a difference of 0.11%).
| Demographics | Rating | Rank | Median Female Earnings |
| Czechoslovakians | 12.0 /100 | #210 | Poor $38,738 |
| Aleuts | 11.6 /100 | #211 | Poor $38,719 |
| Guamanians/Chamorros | 11.5 /100 | #212 | Poor $38,717 |
| Jamaicans | 10.5 /100 | #213 | Poor $38,670 |
| Iraqis | 10.5 /100 | #214 | Poor $38,666 |
| Spaniards | 10.3 /100 | #215 | Poor $38,656 |
| Immigrants | Ecuador | 10.1 /100 | #216 | Poor $38,644 |
| Immigrants | Jamaica | 9.7 /100 | #217 | Tragic $38,625 |
| Cape Verdeans | 9.5 /100 | #218 | Tragic $38,614 |
| Nepalese | 9.3 /100 | #219 | Tragic $38,603 |
| Yugoslavians | 8.8 /100 | #220 | Tragic $38,573 |
| Immigrants | Azores | 8.8 /100 | #221 | Tragic $38,573 |
| Japanese | 8.1 /100 | #222 | Tragic $38,528 |
| Immigrants | Sudan | 7.8 /100 | #223 | Tragic $38,511 |
| Native Hawaiians | 7.1 /100 | #224 | Tragic $38,461 |