Shoshone vs Okinawan Median Female Earnings
COMPARE
Shoshone
Okinawan
Median Female Earnings
Median Female Earnings Comparison
Shoshone
Okinawans
$34,677
MEDIAN FEMALE EARNINGS
0.0/ 100
METRIC RATING
319th/ 347
METRIC RANK
$46,905
MEDIAN FEMALE EARNINGS
100.0/ 100
METRIC RATING
11th/ 347
METRIC RANK
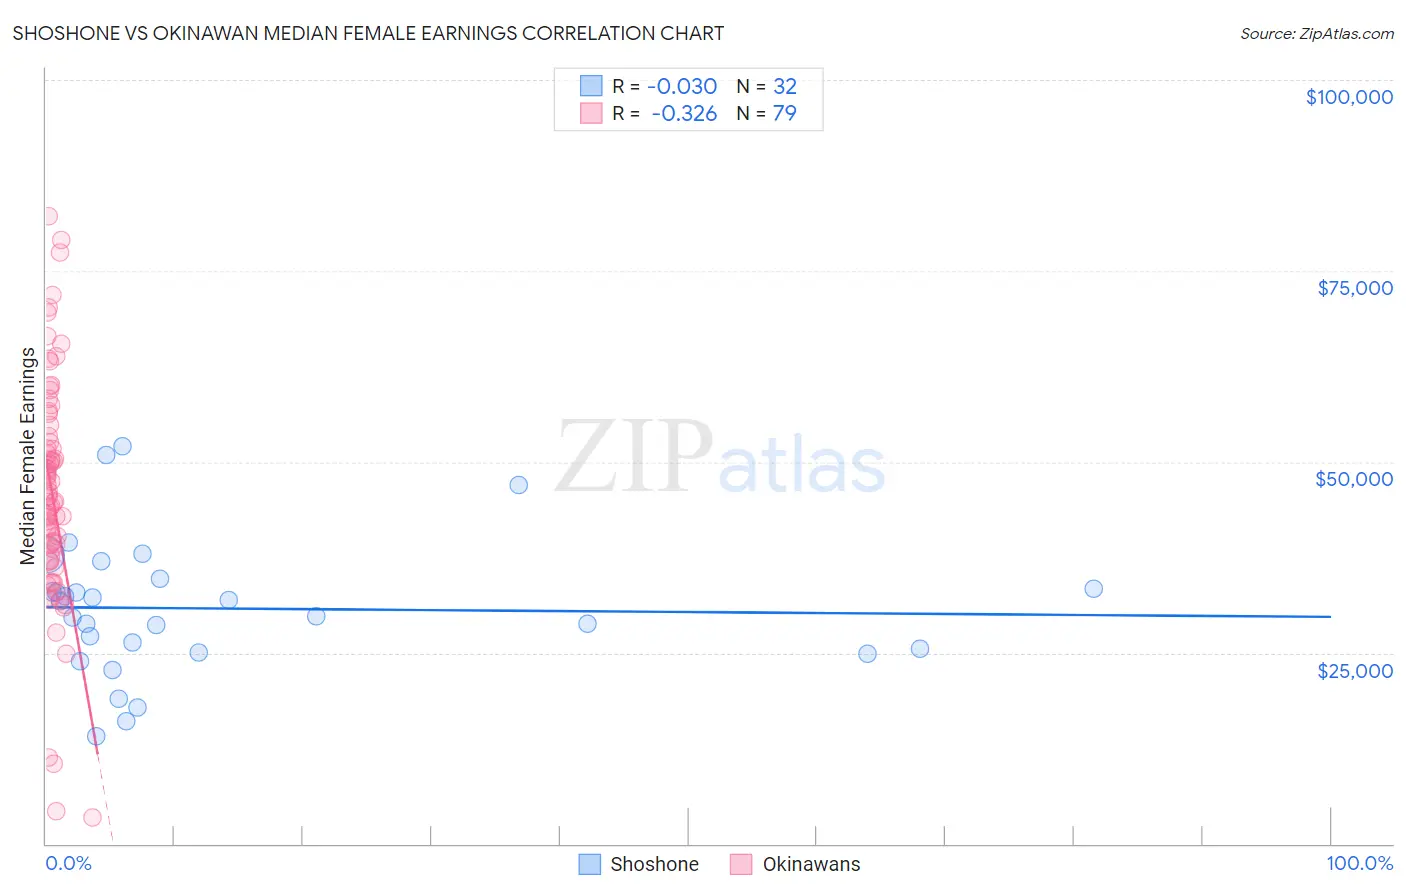
Shoshone vs Okinawan Median Female Earnings Correlation Chart
The statistical analysis conducted on geographies consisting of 66,610,433 people shows no correlation between the proportion of Shoshone and median female earnings in the United States with a correlation coefficient (R) of -0.030 and weighted average of $34,677. Similarly, the statistical analysis conducted on geographies consisting of 73,768,559 people shows a mild negative correlation between the proportion of Okinawans and median female earnings in the United States with a correlation coefficient (R) of -0.326 and weighted average of $46,905, a difference of 35.3%.
Median Female Earnings Correlation Summary
| Measurement | Shoshone | Okinawan |
| Minimum | $14,091 | $3,494 |
| Maximum | $52,089 | $82,101 |
| Range | $37,998 | $78,607 |
| Mean | $30,807 | $45,866 |
| Median | $30,799 | $45,553 |
| Interquartile 25% (IQ1) | $25,287 | $37,429 |
| Interquartile 75% (IQ3) | $34,049 | $53,420 |
| Interquartile Range (IQR) | $8,762 | $15,991 |
| Standard Deviation (Sample) | $8,852 | $15,052 |
| Standard Deviation (Population) | $8,713 | $14,956 |
Similar Demographics by Median Female Earnings
Demographics Similar to Shoshone by Median Female Earnings
In terms of median female earnings, the demographic groups most similar to Shoshone are Immigrants from Yemen ($34,693, a difference of 0.050%), Immigrants from Honduras ($34,647, a difference of 0.090%), Potawatomi ($34,739, a difference of 0.18%), Cherokee ($34,742, a difference of 0.19%), and Pennsylvania German ($34,802, a difference of 0.36%).
| Demographics | Rating | Rank | Median Female Earnings |
| Yaqui | 0.0 /100 | #312 | Tragic $34,943 |
| Cubans | 0.0 /100 | #313 | Tragic $34,942 |
| Apache | 0.0 /100 | #314 | Tragic $34,895 |
| Pennsylvania Germans | 0.0 /100 | #315 | Tragic $34,802 |
| Cherokee | 0.0 /100 | #316 | Tragic $34,742 |
| Potawatomi | 0.0 /100 | #317 | Tragic $34,739 |
| Immigrants | Yemen | 0.0 /100 | #318 | Tragic $34,693 |
| Shoshone | 0.0 /100 | #319 | Tragic $34,677 |
| Immigrants | Honduras | 0.0 /100 | #320 | Tragic $34,647 |
| Hispanics or Latinos | 0.0 /100 | #321 | Tragic $34,421 |
| Chickasaw | 0.0 /100 | #322 | Tragic $34,414 |
| Seminole | 0.0 /100 | #323 | Tragic $34,385 |
| Immigrants | Congo | 0.0 /100 | #324 | Tragic $34,317 |
| Dutch West Indians | 0.0 /100 | #325 | Tragic $34,106 |
| Kiowa | 0.0 /100 | #326 | Tragic $34,074 |
Demographics Similar to Okinawans by Median Female Earnings
In terms of median female earnings, the demographic groups most similar to Okinawans are Immigrants from Israel ($46,902, a difference of 0.010%), Immigrants from China ($46,972, a difference of 0.14%), Immigrants from Iran ($47,154, a difference of 0.53%), Immigrants from Australia ($46,573, a difference of 0.71%), and Soviet Union ($46,556, a difference of 0.75%).
| Demographics | Rating | Rank | Median Female Earnings |
| Immigrants | India | 100.0 /100 | #4 | Exceptional $48,292 |
| Immigrants | Singapore | 100.0 /100 | #5 | Exceptional $47,986 |
| Immigrants | Ireland | 100.0 /100 | #6 | Exceptional $47,598 |
| Thais | 100.0 /100 | #7 | Exceptional $47,577 |
| Iranians | 100.0 /100 | #8 | Exceptional $47,421 |
| Immigrants | Iran | 100.0 /100 | #9 | Exceptional $47,154 |
| Immigrants | China | 100.0 /100 | #10 | Exceptional $46,972 |
| Okinawans | 100.0 /100 | #11 | Exceptional $46,905 |
| Immigrants | Israel | 100.0 /100 | #12 | Exceptional $46,902 |
| Immigrants | Australia | 100.0 /100 | #13 | Exceptional $46,573 |
| Soviet Union | 100.0 /100 | #14 | Exceptional $46,556 |
| Immigrants | Eastern Asia | 100.0 /100 | #15 | Exceptional $46,502 |
| Indians (Asian) | 100.0 /100 | #16 | Exceptional $46,481 |
| Immigrants | South Central Asia | 100.0 /100 | #17 | Exceptional $46,324 |
| Cypriots | 100.0 /100 | #18 | Exceptional $45,570 |