Immigrants from Cabo Verde vs Immigrants from Jamaica Median Female Earnings
COMPARE
Immigrants from Cabo Verde
Immigrants from Jamaica
Median Female Earnings
Median Female Earnings Comparison
Immigrants from Cabo Verde
Immigrants from Jamaica
$38,208
MEDIAN FEMALE EARNINGS
4.3/ 100
METRIC RATING
237th/ 347
METRIC RANK
$38,625
MEDIAN FEMALE EARNINGS
9.7/ 100
METRIC RATING
217th/ 347
METRIC RANK
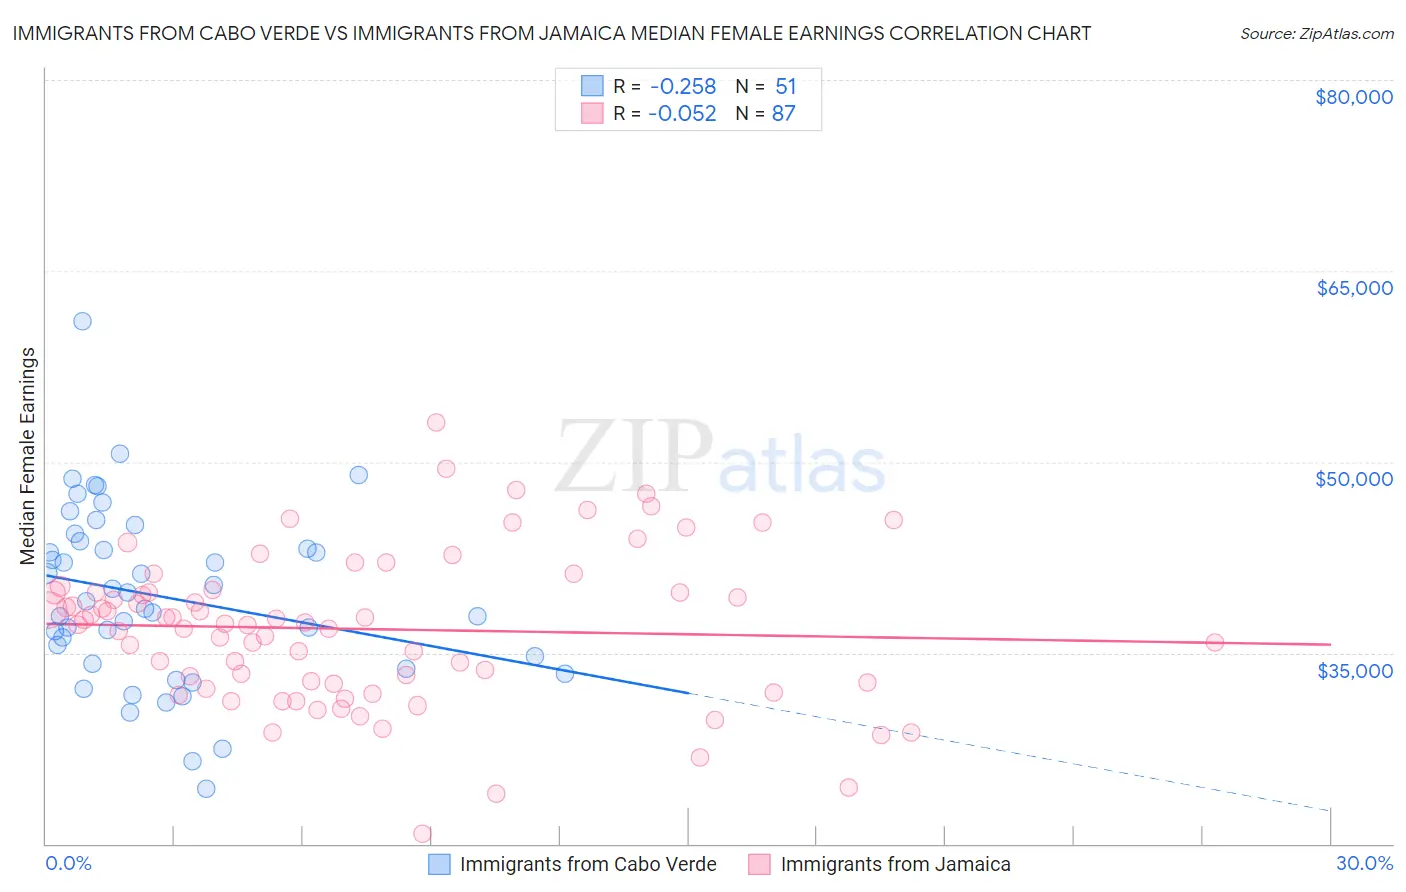
Immigrants from Cabo Verde vs Immigrants from Jamaica Median Female Earnings Correlation Chart
The statistical analysis conducted on geographies consisting of 38,158,316 people shows a weak negative correlation between the proportion of Immigrants from Cabo Verde and median female earnings in the United States with a correlation coefficient (R) of -0.258 and weighted average of $38,208. Similarly, the statistical analysis conducted on geographies consisting of 301,720,032 people shows a slight negative correlation between the proportion of Immigrants from Jamaica and median female earnings in the United States with a correlation coefficient (R) of -0.052 and weighted average of $38,625, a difference of 1.1%.
Median Female Earnings Correlation Summary
| Measurement | Immigrants from Cabo Verde | Immigrants from Jamaica |
| Minimum | $24,340 | $20,815 |
| Maximum | $61,096 | $53,086 |
| Range | $36,756 | $32,271 |
| Mean | $39,427 | $36,867 |
| Median | $39,071 | $37,264 |
| Interquartile 25% (IQ1) | $34,187 | $32,574 |
| Interquartile 75% (IQ3) | $43,779 | $39,745 |
| Interquartile Range (IQR) | $9,592 | $7,171 |
| Standard Deviation (Sample) | $6,953 | $5,965 |
| Standard Deviation (Population) | $6,885 | $5,931 |
Demographics Similar to Immigrants from Cabo Verde and Immigrants from Jamaica by Median Female Earnings
In terms of median female earnings, the demographic groups most similar to Immigrants from Cabo Verde are Sudanese ($38,215, a difference of 0.020%), Liberian ($38,215, a difference of 0.020%), Celtic ($38,283, a difference of 0.20%), Tongan ($38,288, a difference of 0.21%), and Scandinavian ($38,306, a difference of 0.26%). Similarly, the demographic groups most similar to Immigrants from Jamaica are Cape Verdean ($38,614, a difference of 0.030%), Nepalese ($38,603, a difference of 0.060%), Yugoslavian ($38,573, a difference of 0.14%), Immigrants from the Azores ($38,573, a difference of 0.14%), and Japanese ($38,528, a difference of 0.25%).
| Demographics | Rating | Rank | Median Female Earnings |
| Immigrants | Jamaica | 9.7 /100 | #217 | Tragic $38,625 |
| Cape Verdeans | 9.5 /100 | #218 | Tragic $38,614 |
| Nepalese | 9.3 /100 | #219 | Tragic $38,603 |
| Yugoslavians | 8.8 /100 | #220 | Tragic $38,573 |
| Immigrants | Azores | 8.8 /100 | #221 | Tragic $38,573 |
| Japanese | 8.1 /100 | #222 | Tragic $38,528 |
| Immigrants | Sudan | 7.8 /100 | #223 | Tragic $38,511 |
| Native Hawaiians | 7.1 /100 | #224 | Tragic $38,461 |
| French | 7.0 /100 | #225 | Tragic $38,457 |
| French Canadians | 6.8 /100 | #226 | Tragic $38,436 |
| Scottish | 6.3 /100 | #227 | Tragic $38,397 |
| Sub-Saharan Africans | 6.2 /100 | #228 | Tragic $38,391 |
| Belgians | 6.1 /100 | #229 | Tragic $38,382 |
| Basques | 5.7 /100 | #230 | Tragic $38,352 |
| Somalis | 5.5 /100 | #231 | Tragic $38,333 |
| Scandinavians | 5.2 /100 | #232 | Tragic $38,306 |
| Tongans | 5.1 /100 | #233 | Tragic $38,288 |
| Celtics | 5.0 /100 | #234 | Tragic $38,283 |
| Sudanese | 4.4 /100 | #235 | Tragic $38,215 |
| Liberians | 4.4 /100 | #236 | Tragic $38,215 |
| Immigrants | Cabo Verde | 4.3 /100 | #237 | Tragic $38,208 |