Shoshone vs Immigrants from Afghanistan Median Earnings
COMPARE
Shoshone
Immigrants from Afghanistan
Median Earnings
Median Earnings Comparison
Shoshone
Immigrants from Afghanistan
$40,932
MEDIAN EARNINGS
0.0/ 100
METRIC RATING
302nd/ 347
METRIC RANK
$49,645
MEDIAN EARNINGS
98.9/ 100
METRIC RATING
99th/ 347
METRIC RANK
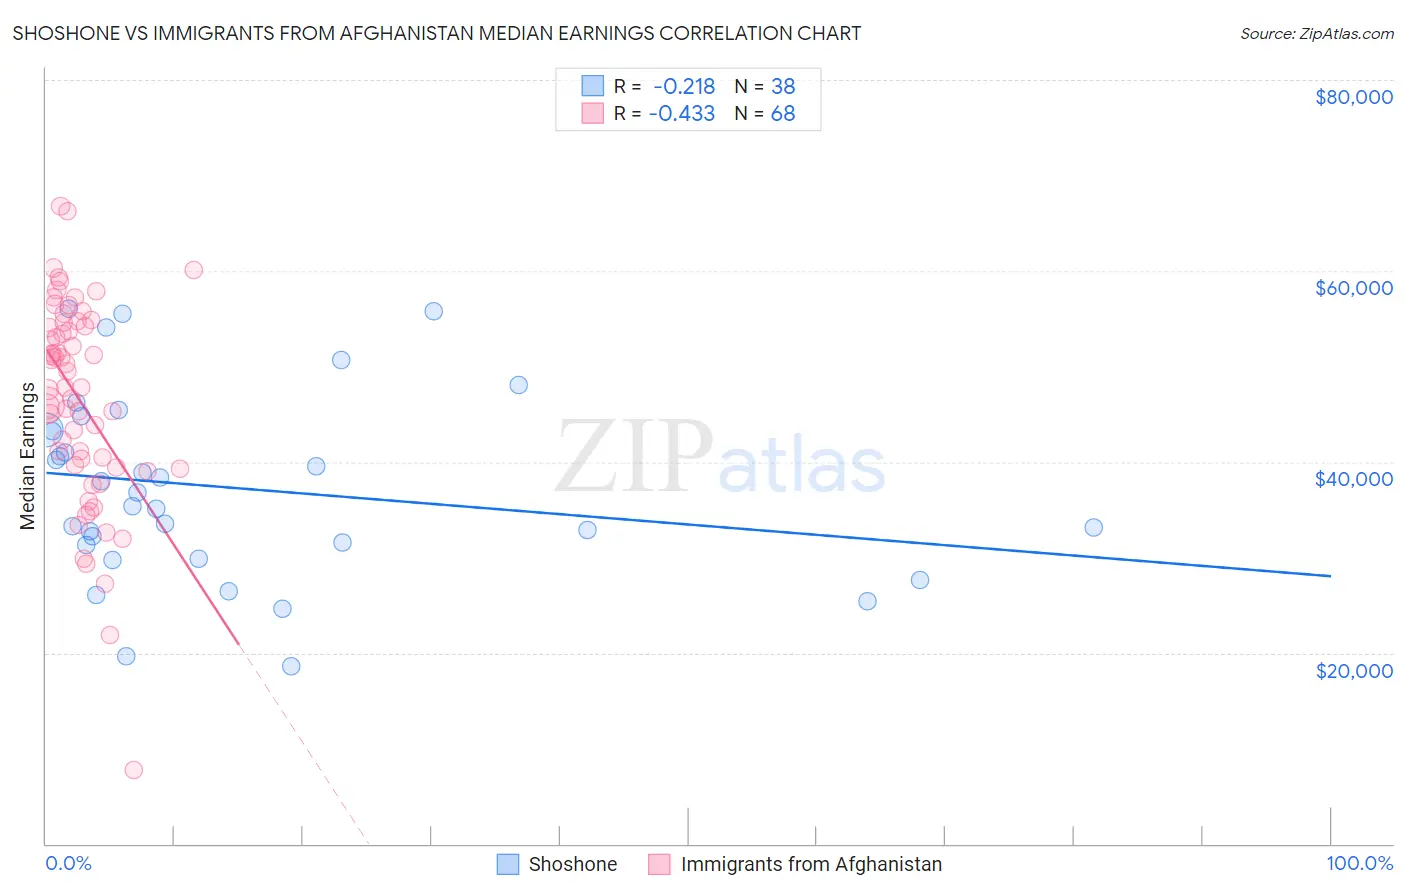
Shoshone vs Immigrants from Afghanistan Median Earnings Correlation Chart
The statistical analysis conducted on geographies consisting of 66,619,980 people shows a weak negative correlation between the proportion of Shoshone and median earnings in the United States with a correlation coefficient (R) of -0.218 and weighted average of $40,932. Similarly, the statistical analysis conducted on geographies consisting of 147,645,000 people shows a moderate negative correlation between the proportion of Immigrants from Afghanistan and median earnings in the United States with a correlation coefficient (R) of -0.433 and weighted average of $49,645, a difference of 21.3%.
Median Earnings Correlation Summary
| Measurement | Shoshone | Immigrants from Afghanistan |
| Minimum | $18,625 | $7,703 |
| Maximum | $56,007 | $66,757 |
| Range | $37,382 | $59,054 |
| Mean | $37,253 | $46,511 |
| Median | $36,104 | $47,775 |
| Interquartile 25% (IQ1) | $31,272 | $39,495 |
| Interquartile 75% (IQ3) | $43,286 | $54,376 |
| Interquartile Range (IQR) | $12,015 | $14,881 |
| Standard Deviation (Sample) | $9,755 | $10,763 |
| Standard Deviation (Population) | $9,625 | $10,683 |
Similar Demographics by Median Earnings
Demographics Similar to Shoshone by Median Earnings
In terms of median earnings, the demographic groups most similar to Shoshone are Haitian ($40,918, a difference of 0.030%), Immigrants from Guatemala ($40,851, a difference of 0.20%), Ute ($41,051, a difference of 0.29%), Immigrants from Latin America ($41,049, a difference of 0.29%), and Immigrants from Caribbean ($41,119, a difference of 0.46%).
| Demographics | Rating | Rank | Median Earnings |
| Bangladeshis | 0.1 /100 | #295 | Tragic $41,263 |
| Cherokee | 0.1 /100 | #296 | Tragic $41,252 |
| Guatemalans | 0.1 /100 | #297 | Tragic $41,205 |
| Immigrants | Micronesia | 0.1 /100 | #298 | Tragic $41,133 |
| Immigrants | Caribbean | 0.1 /100 | #299 | Tragic $41,119 |
| Ute | 0.1 /100 | #300 | Tragic $41,051 |
| Immigrants | Latin America | 0.1 /100 | #301 | Tragic $41,049 |
| Shoshone | 0.0 /100 | #302 | Tragic $40,932 |
| Haitians | 0.0 /100 | #303 | Tragic $40,918 |
| Immigrants | Guatemala | 0.0 /100 | #304 | Tragic $40,851 |
| Chickasaw | 0.0 /100 | #305 | Tragic $40,672 |
| Yaqui | 0.0 /100 | #306 | Tragic $40,647 |
| Hondurans | 0.0 /100 | #307 | Tragic $40,638 |
| Cubans | 0.0 /100 | #308 | Tragic $40,619 |
| Immigrants | Haiti | 0.0 /100 | #309 | Tragic $40,550 |
Demographics Similar to Immigrants from Afghanistan by Median Earnings
In terms of median earnings, the demographic groups most similar to Immigrants from Afghanistan are Immigrants from Northern Africa ($49,648, a difference of 0.010%), Immigrants from Poland ($49,633, a difference of 0.020%), Immigrants from North Macedonia ($49,658, a difference of 0.030%), Jordanian ($49,632, a difference of 0.030%), and Immigrants from Lebanon ($49,682, a difference of 0.070%).
| Demographics | Rating | Rank | Median Earnings |
| Immigrants | Argentina | 99.2 /100 | #92 | Exceptional $49,841 |
| Armenians | 99.1 /100 | #93 | Exceptional $49,804 |
| Croatians | 99.0 /100 | #94 | Exceptional $49,724 |
| Immigrants | England | 99.0 /100 | #95 | Exceptional $49,722 |
| Immigrants | Lebanon | 99.0 /100 | #96 | Exceptional $49,682 |
| Immigrants | North Macedonia | 98.9 /100 | #97 | Exceptional $49,658 |
| Immigrants | Northern Africa | 98.9 /100 | #98 | Exceptional $49,648 |
| Immigrants | Afghanistan | 98.9 /100 | #99 | Exceptional $49,645 |
| Immigrants | Poland | 98.9 /100 | #100 | Exceptional $49,633 |
| Jordanians | 98.9 /100 | #101 | Exceptional $49,632 |
| Ethiopians | 98.8 /100 | #102 | Exceptional $49,572 |
| Austrians | 98.7 /100 | #103 | Exceptional $49,501 |
| Immigrants | Brazil | 98.6 /100 | #104 | Exceptional $49,463 |
| Immigrants | Western Asia | 98.4 /100 | #105 | Exceptional $49,389 |
| Immigrants | Albania | 98.4 /100 | #106 | Exceptional $49,377 |