Peruvian vs Immigrants from Afghanistan Median Earnings
COMPARE
Peruvian
Immigrants from Afghanistan
Median Earnings
Median Earnings Comparison
Peruvians
Immigrants from Afghanistan
$47,628
MEDIAN EARNINGS
84.2/ 100
METRIC RATING
150th/ 347
METRIC RANK
$49,645
MEDIAN EARNINGS
98.9/ 100
METRIC RATING
99th/ 347
METRIC RANK
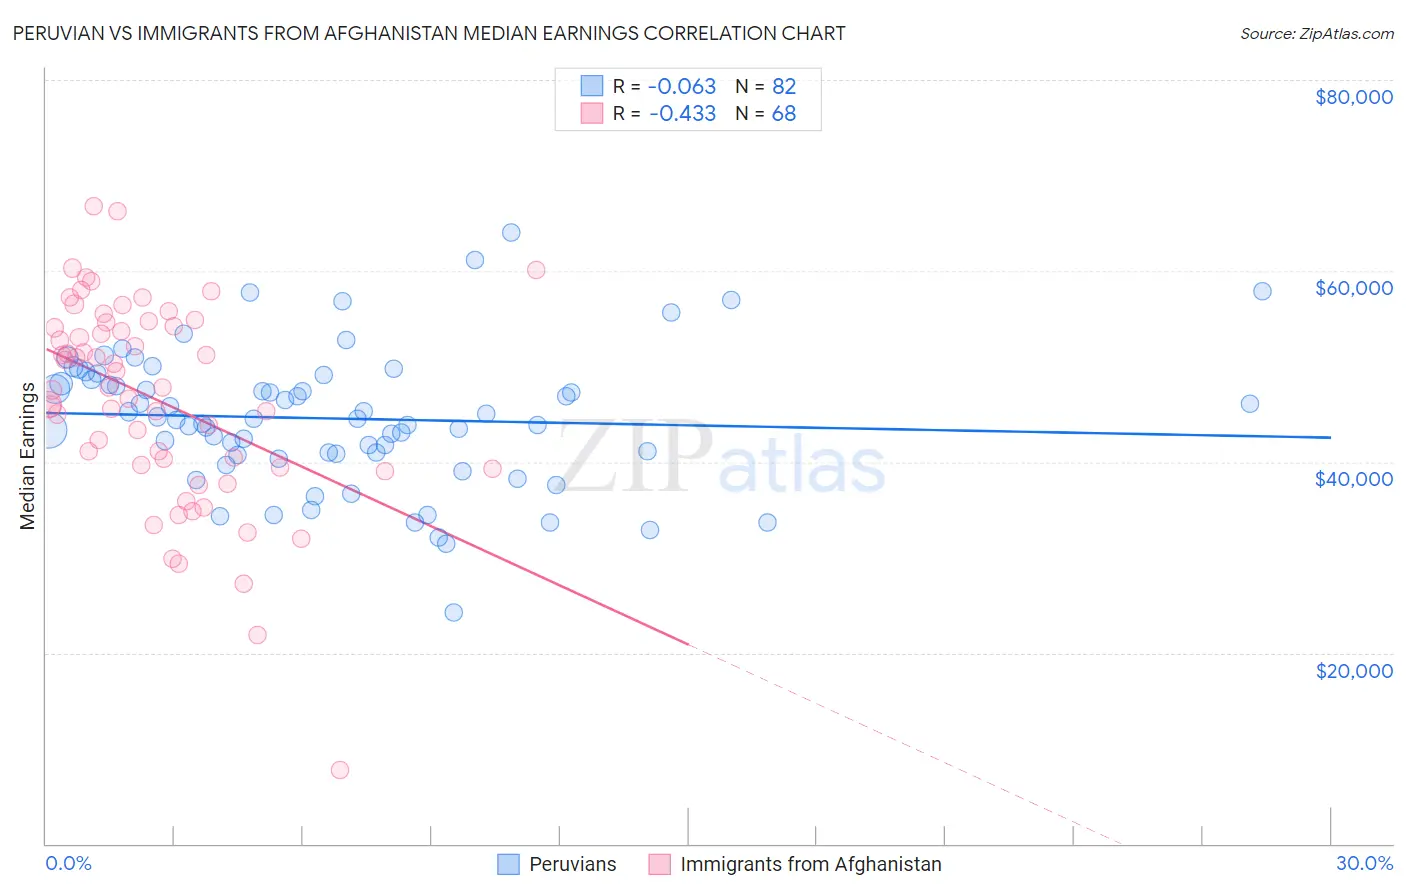
Peruvian vs Immigrants from Afghanistan Median Earnings Correlation Chart
The statistical analysis conducted on geographies consisting of 363,247,580 people shows a slight negative correlation between the proportion of Peruvians and median earnings in the United States with a correlation coefficient (R) of -0.063 and weighted average of $47,628. Similarly, the statistical analysis conducted on geographies consisting of 147,645,000 people shows a moderate negative correlation between the proportion of Immigrants from Afghanistan and median earnings in the United States with a correlation coefficient (R) of -0.433 and weighted average of $49,645, a difference of 4.2%.
Median Earnings Correlation Summary
| Measurement | Peruvian | Immigrants from Afghanistan |
| Minimum | $24,212 | $7,703 |
| Maximum | $64,091 | $66,757 |
| Range | $39,879 | $59,054 |
| Mean | $44,547 | $46,511 |
| Median | $44,525 | $47,775 |
| Interquartile 25% (IQ1) | $40,828 | $39,495 |
| Interquartile 75% (IQ3) | $48,604 | $54,376 |
| Interquartile Range (IQR) | $7,775 | $14,881 |
| Standard Deviation (Sample) | $7,153 | $10,763 |
| Standard Deviation (Population) | $7,110 | $10,683 |
Similar Demographics by Median Earnings
Demographics Similar to Peruvians by Median Earnings
In terms of median earnings, the demographic groups most similar to Peruvians are Luxembourger ($47,640, a difference of 0.020%), Immigrants from Oceania ($47,617, a difference of 0.020%), Immigrants from Eritrea ($47,657, a difference of 0.060%), Immigrants from South Eastern Asia ($47,671, a difference of 0.090%), and Immigrants from Germany ($47,566, a difference of 0.13%).
| Demographics | Rating | Rank | Median Earnings |
| Swedes | 88.0 /100 | #143 | Excellent $47,851 |
| Hungarians | 87.1 /100 | #144 | Excellent $47,795 |
| Immigrants | Saudi Arabia | 85.6 /100 | #145 | Excellent $47,704 |
| Immigrants | Chile | 85.5 /100 | #146 | Excellent $47,697 |
| Immigrants | South Eastern Asia | 85.0 /100 | #147 | Excellent $47,671 |
| Immigrants | Eritrea | 84.8 /100 | #148 | Excellent $47,657 |
| Luxembourgers | 84.5 /100 | #149 | Excellent $47,640 |
| Peruvians | 84.2 /100 | #150 | Excellent $47,628 |
| Immigrants | Oceania | 84.1 /100 | #151 | Excellent $47,617 |
| Immigrants | Germany | 83.1 /100 | #152 | Excellent $47,566 |
| Slavs | 81.1 /100 | #153 | Excellent $47,470 |
| Immigrants | Portugal | 77.3 /100 | #154 | Good $47,304 |
| Immigrants | Vietnam | 76.7 /100 | #155 | Good $47,282 |
| Irish | 76.6 /100 | #156 | Good $47,276 |
| Czechs | 75.1 /100 | #157 | Good $47,221 |
Demographics Similar to Immigrants from Afghanistan by Median Earnings
In terms of median earnings, the demographic groups most similar to Immigrants from Afghanistan are Immigrants from Northern Africa ($49,648, a difference of 0.010%), Immigrants from Poland ($49,633, a difference of 0.020%), Immigrants from North Macedonia ($49,658, a difference of 0.030%), Jordanian ($49,632, a difference of 0.030%), and Immigrants from Lebanon ($49,682, a difference of 0.070%).
| Demographics | Rating | Rank | Median Earnings |
| Immigrants | Argentina | 99.2 /100 | #92 | Exceptional $49,841 |
| Armenians | 99.1 /100 | #93 | Exceptional $49,804 |
| Croatians | 99.0 /100 | #94 | Exceptional $49,724 |
| Immigrants | England | 99.0 /100 | #95 | Exceptional $49,722 |
| Immigrants | Lebanon | 99.0 /100 | #96 | Exceptional $49,682 |
| Immigrants | North Macedonia | 98.9 /100 | #97 | Exceptional $49,658 |
| Immigrants | Northern Africa | 98.9 /100 | #98 | Exceptional $49,648 |
| Immigrants | Afghanistan | 98.9 /100 | #99 | Exceptional $49,645 |
| Immigrants | Poland | 98.9 /100 | #100 | Exceptional $49,633 |
| Jordanians | 98.9 /100 | #101 | Exceptional $49,632 |
| Ethiopians | 98.8 /100 | #102 | Exceptional $49,572 |
| Austrians | 98.7 /100 | #103 | Exceptional $49,501 |
| Immigrants | Brazil | 98.6 /100 | #104 | Exceptional $49,463 |
| Immigrants | Western Asia | 98.4 /100 | #105 | Exceptional $49,389 |
| Immigrants | Albania | 98.4 /100 | #106 | Exceptional $49,377 |