Shoshone vs New Zealander Median Earnings
COMPARE
Shoshone
New Zealander
Median Earnings
Median Earnings Comparison
Shoshone
New Zealanders
$40,932
MEDIAN EARNINGS
0.0/ 100
METRIC RATING
302nd/ 347
METRIC RANK
$51,246
MEDIAN EARNINGS
99.9/ 100
METRIC RATING
64th/ 347
METRIC RANK
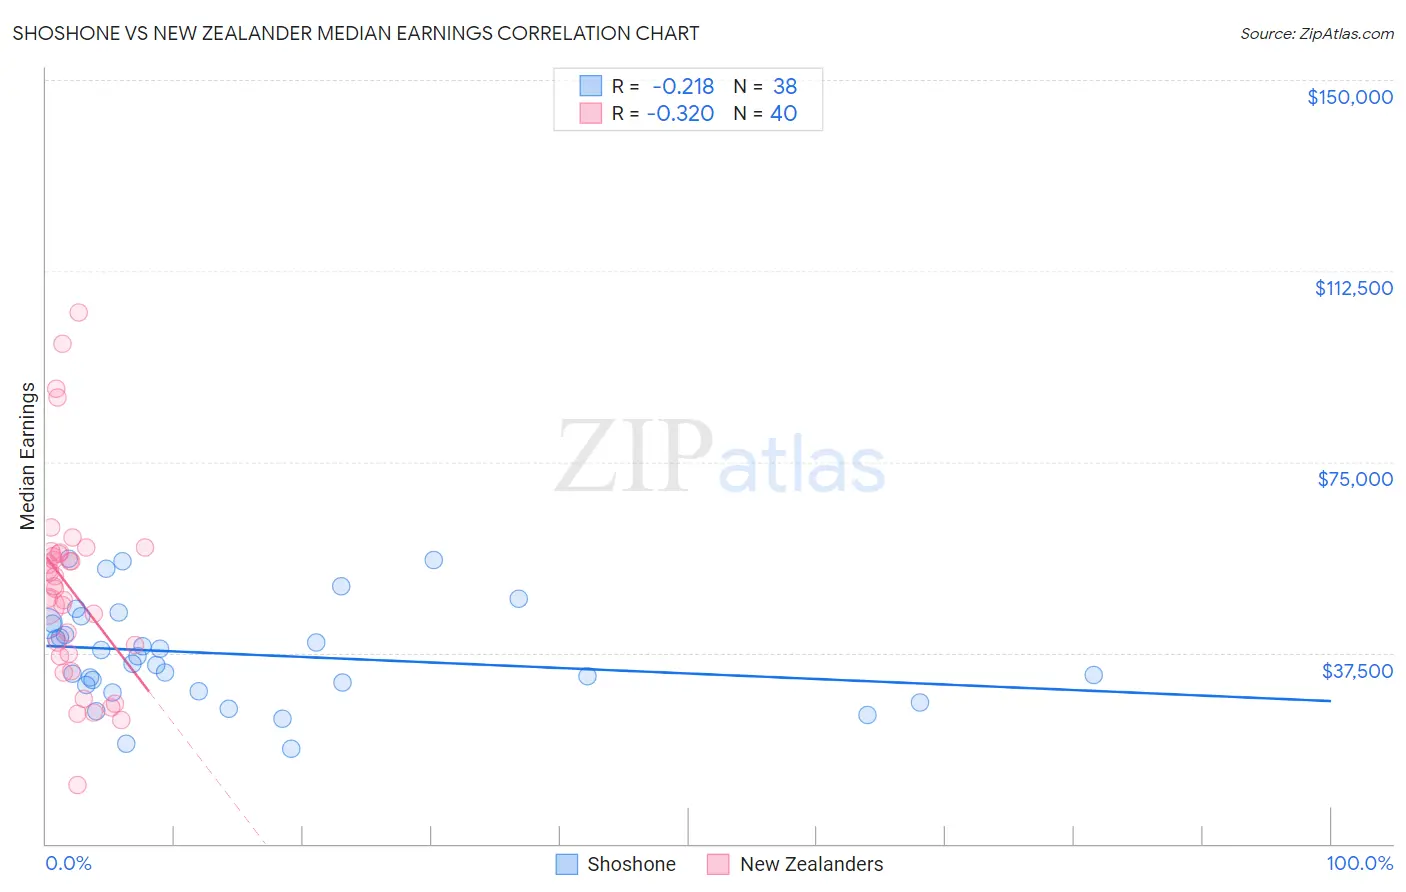
Shoshone vs New Zealander Median Earnings Correlation Chart
The statistical analysis conducted on geographies consisting of 66,619,980 people shows a weak negative correlation between the proportion of Shoshone and median earnings in the United States with a correlation coefficient (R) of -0.218 and weighted average of $40,932. Similarly, the statistical analysis conducted on geographies consisting of 106,916,811 people shows a mild negative correlation between the proportion of New Zealanders and median earnings in the United States with a correlation coefficient (R) of -0.320 and weighted average of $51,246, a difference of 25.2%.
Median Earnings Correlation Summary
| Measurement | Shoshone | New Zealander |
| Minimum | $18,625 | $11,591 |
| Maximum | $56,007 | $104,409 |
| Range | $37,382 | $92,818 |
| Mean | $37,253 | $49,845 |
| Median | $36,104 | $50,398 |
| Interquartile 25% (IQ1) | $31,272 | $37,107 |
| Interquartile 75% (IQ3) | $43,286 | $57,034 |
| Interquartile Range (IQR) | $12,015 | $19,927 |
| Standard Deviation (Sample) | $9,755 | $19,630 |
| Standard Deviation (Population) | $9,625 | $19,383 |
Similar Demographics by Median Earnings
Demographics Similar to Shoshone by Median Earnings
In terms of median earnings, the demographic groups most similar to Shoshone are Haitian ($40,918, a difference of 0.030%), Immigrants from Guatemala ($40,851, a difference of 0.20%), Ute ($41,051, a difference of 0.29%), Immigrants from Latin America ($41,049, a difference of 0.29%), and Immigrants from Caribbean ($41,119, a difference of 0.46%).
| Demographics | Rating | Rank | Median Earnings |
| Bangladeshis | 0.1 /100 | #295 | Tragic $41,263 |
| Cherokee | 0.1 /100 | #296 | Tragic $41,252 |
| Guatemalans | 0.1 /100 | #297 | Tragic $41,205 |
| Immigrants | Micronesia | 0.1 /100 | #298 | Tragic $41,133 |
| Immigrants | Caribbean | 0.1 /100 | #299 | Tragic $41,119 |
| Ute | 0.1 /100 | #300 | Tragic $41,051 |
| Immigrants | Latin America | 0.1 /100 | #301 | Tragic $41,049 |
| Shoshone | 0.0 /100 | #302 | Tragic $40,932 |
| Haitians | 0.0 /100 | #303 | Tragic $40,918 |
| Immigrants | Guatemala | 0.0 /100 | #304 | Tragic $40,851 |
| Chickasaw | 0.0 /100 | #305 | Tragic $40,672 |
| Yaqui | 0.0 /100 | #306 | Tragic $40,647 |
| Hondurans | 0.0 /100 | #307 | Tragic $40,638 |
| Cubans | 0.0 /100 | #308 | Tragic $40,619 |
| Immigrants | Haiti | 0.0 /100 | #309 | Tragic $40,550 |
Demographics Similar to New Zealanders by Median Earnings
In terms of median earnings, the demographic groups most similar to New Zealanders are Immigrants from Bulgaria ($51,318, a difference of 0.14%), Greek ($51,164, a difference of 0.16%), Immigrants from Romania ($51,337, a difference of 0.18%), Afghan ($51,112, a difference of 0.26%), and Immigrants from Spain ($51,092, a difference of 0.30%).
| Demographics | Rating | Rank | Median Earnings |
| Immigrants | Eastern Europe | 99.9 /100 | #57 | Exceptional $51,624 |
| Immigrants | Bolivia | 99.9 /100 | #58 | Exceptional $51,605 |
| Immigrants | Croatia | 99.9 /100 | #59 | Exceptional $51,581 |
| Immigrants | Serbia | 99.9 /100 | #60 | Exceptional $51,557 |
| Immigrants | Latvia | 99.9 /100 | #61 | Exceptional $51,555 |
| Immigrants | Romania | 99.9 /100 | #62 | Exceptional $51,337 |
| Immigrants | Bulgaria | 99.9 /100 | #63 | Exceptional $51,318 |
| New Zealanders | 99.9 /100 | #64 | Exceptional $51,246 |
| Greeks | 99.9 /100 | #65 | Exceptional $51,164 |
| Afghans | 99.9 /100 | #66 | Exceptional $51,112 |
| Immigrants | Spain | 99.9 /100 | #67 | Exceptional $51,092 |
| Paraguayans | 99.9 /100 | #68 | Exceptional $51,068 |
| Mongolians | 99.8 /100 | #69 | Exceptional $51,038 |
| Lithuanians | 99.8 /100 | #70 | Exceptional $50,991 |
| Immigrants | Ukraine | 99.8 /100 | #71 | Exceptional $50,984 |