Shoshone vs Swedish Median Earnings
COMPARE
Shoshone
Swedish
Median Earnings
Median Earnings Comparison
Shoshone
Swedes
$40,932
MEDIAN EARNINGS
0.0/ 100
METRIC RATING
302nd/ 347
METRIC RANK
$47,851
MEDIAN EARNINGS
88.0/ 100
METRIC RATING
143rd/ 347
METRIC RANK
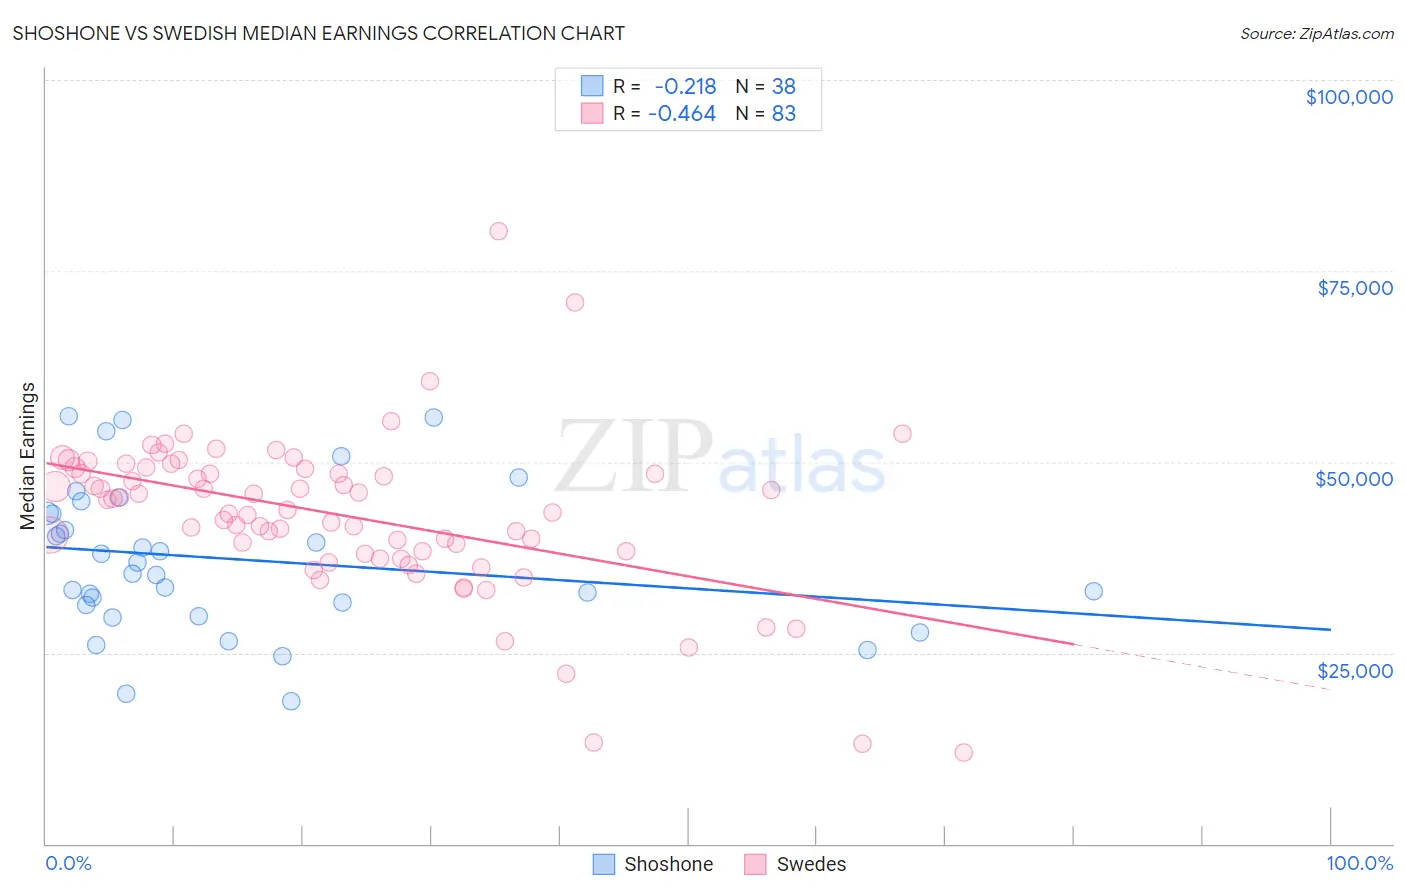
Shoshone vs Swedish Median Earnings Correlation Chart
The statistical analysis conducted on geographies consisting of 66,619,980 people shows a weak negative correlation between the proportion of Shoshone and median earnings in the United States with a correlation coefficient (R) of -0.218 and weighted average of $40,932. Similarly, the statistical analysis conducted on geographies consisting of 538,996,314 people shows a moderate negative correlation between the proportion of Swedes and median earnings in the United States with a correlation coefficient (R) of -0.464 and weighted average of $47,851, a difference of 16.9%.
Median Earnings Correlation Summary
| Measurement | Shoshone | Swedish |
| Minimum | $18,625 | $11,875 |
| Maximum | $56,007 | $80,254 |
| Range | $37,382 | $68,379 |
| Mean | $37,253 | $42,935 |
| Median | $36,104 | $43,757 |
| Interquartile 25% (IQ1) | $31,272 | $37,994 |
| Interquartile 75% (IQ3) | $43,286 | $49,030 |
| Interquartile Range (IQR) | $12,015 | $11,035 |
| Standard Deviation (Sample) | $9,755 | $10,532 |
| Standard Deviation (Population) | $9,625 | $10,468 |
Similar Demographics by Median Earnings
Demographics Similar to Shoshone by Median Earnings
In terms of median earnings, the demographic groups most similar to Shoshone are Haitian ($40,918, a difference of 0.030%), Immigrants from Guatemala ($40,851, a difference of 0.20%), Ute ($41,051, a difference of 0.29%), Immigrants from Latin America ($41,049, a difference of 0.29%), and Immigrants from Caribbean ($41,119, a difference of 0.46%).
| Demographics | Rating | Rank | Median Earnings |
| Bangladeshis | 0.1 /100 | #295 | Tragic $41,263 |
| Cherokee | 0.1 /100 | #296 | Tragic $41,252 |
| Guatemalans | 0.1 /100 | #297 | Tragic $41,205 |
| Immigrants | Micronesia | 0.1 /100 | #298 | Tragic $41,133 |
| Immigrants | Caribbean | 0.1 /100 | #299 | Tragic $41,119 |
| Ute | 0.1 /100 | #300 | Tragic $41,051 |
| Immigrants | Latin America | 0.1 /100 | #301 | Tragic $41,049 |
| Shoshone | 0.0 /100 | #302 | Tragic $40,932 |
| Haitians | 0.0 /100 | #303 | Tragic $40,918 |
| Immigrants | Guatemala | 0.0 /100 | #304 | Tragic $40,851 |
| Chickasaw | 0.0 /100 | #305 | Tragic $40,672 |
| Yaqui | 0.0 /100 | #306 | Tragic $40,647 |
| Hondurans | 0.0 /100 | #307 | Tragic $40,638 |
| Cubans | 0.0 /100 | #308 | Tragic $40,619 |
| Immigrants | Haiti | 0.0 /100 | #309 | Tragic $40,550 |
Demographics Similar to Swedes by Median Earnings
In terms of median earnings, the demographic groups most similar to Swedes are Ugandan ($47,854, a difference of 0.010%), Immigrants from Sierra Leone ($47,875, a difference of 0.050%), Taiwanese ($47,902, a difference of 0.11%), Hungarian ($47,795, a difference of 0.12%), and European ($47,915, a difference of 0.13%).
| Demographics | Rating | Rank | Median Earnings |
| Slovenes | 90.0 /100 | #136 | Excellent $47,995 |
| Immigrants | Nepal | 89.0 /100 | #137 | Excellent $47,925 |
| Europeans | 88.9 /100 | #138 | Excellent $47,915 |
| Canadians | 88.8 /100 | #139 | Excellent $47,911 |
| Taiwanese | 88.7 /100 | #140 | Excellent $47,902 |
| Immigrants | Sierra Leone | 88.3 /100 | #141 | Excellent $47,875 |
| Ugandans | 88.0 /100 | #142 | Excellent $47,854 |
| Swedes | 88.0 /100 | #143 | Excellent $47,851 |
| Hungarians | 87.1 /100 | #144 | Excellent $47,795 |
| Immigrants | Saudi Arabia | 85.6 /100 | #145 | Excellent $47,704 |
| Immigrants | Chile | 85.5 /100 | #146 | Excellent $47,697 |
| Immigrants | South Eastern Asia | 85.0 /100 | #147 | Excellent $47,671 |
| Immigrants | Eritrea | 84.8 /100 | #148 | Excellent $47,657 |
| Luxembourgers | 84.5 /100 | #149 | Excellent $47,640 |
| Peruvians | 84.2 /100 | #150 | Excellent $47,628 |