Shoshone vs Immigrants from Syria Median Earnings
COMPARE
Shoshone
Immigrants from Syria
Median Earnings
Median Earnings Comparison
Shoshone
Immigrants from Syria
$40,932
MEDIAN EARNINGS
0.0/ 100
METRIC RATING
302nd/ 347
METRIC RANK
$48,375
MEDIAN EARNINGS
93.9/ 100
METRIC RATING
123rd/ 347
METRIC RANK
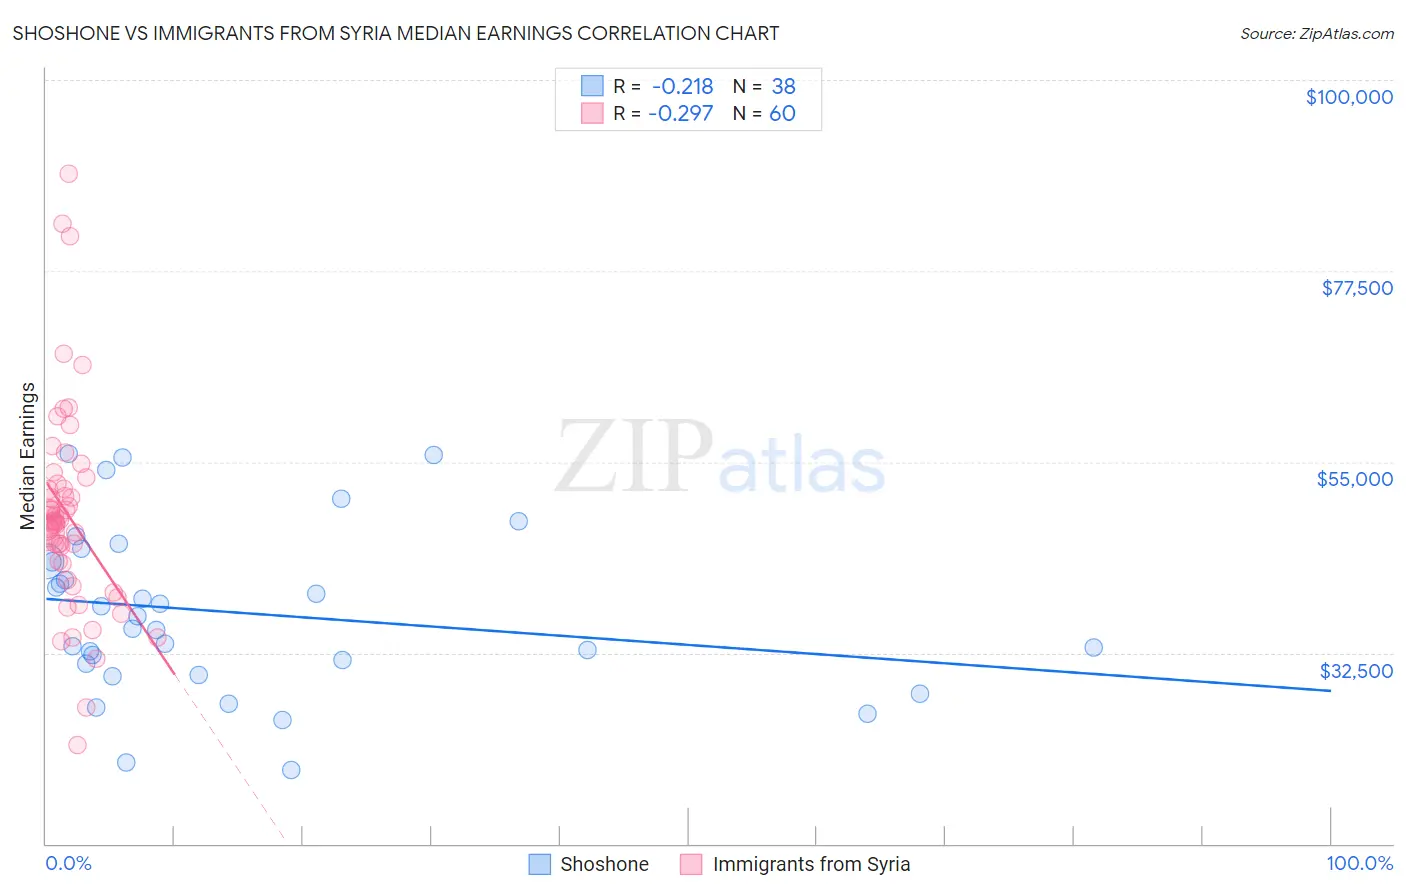
Shoshone vs Immigrants from Syria Median Earnings Correlation Chart
The statistical analysis conducted on geographies consisting of 66,619,980 people shows a weak negative correlation between the proportion of Shoshone and median earnings in the United States with a correlation coefficient (R) of -0.218 and weighted average of $40,932. Similarly, the statistical analysis conducted on geographies consisting of 174,102,272 people shows a weak negative correlation between the proportion of Immigrants from Syria and median earnings in the United States with a correlation coefficient (R) of -0.297 and weighted average of $48,375, a difference of 18.2%.
Median Earnings Correlation Summary
| Measurement | Shoshone | Immigrants from Syria |
| Minimum | $18,625 | $21,696 |
| Maximum | $56,007 | $88,902 |
| Range | $37,382 | $67,206 |
| Mean | $37,253 | $48,829 |
| Median | $36,104 | $48,019 |
| Interquartile 25% (IQ1) | $31,272 | $43,163 |
| Interquartile 75% (IQ3) | $43,286 | $52,131 |
| Interquartile Range (IQR) | $12,015 | $8,968 |
| Standard Deviation (Sample) | $9,755 | $12,024 |
| Standard Deviation (Population) | $9,625 | $11,923 |
Similar Demographics by Median Earnings
Demographics Similar to Shoshone by Median Earnings
In terms of median earnings, the demographic groups most similar to Shoshone are Haitian ($40,918, a difference of 0.030%), Immigrants from Guatemala ($40,851, a difference of 0.20%), Ute ($41,051, a difference of 0.29%), Immigrants from Latin America ($41,049, a difference of 0.29%), and Immigrants from Caribbean ($41,119, a difference of 0.46%).
| Demographics | Rating | Rank | Median Earnings |
| Bangladeshis | 0.1 /100 | #295 | Tragic $41,263 |
| Cherokee | 0.1 /100 | #296 | Tragic $41,252 |
| Guatemalans | 0.1 /100 | #297 | Tragic $41,205 |
| Immigrants | Micronesia | 0.1 /100 | #298 | Tragic $41,133 |
| Immigrants | Caribbean | 0.1 /100 | #299 | Tragic $41,119 |
| Ute | 0.1 /100 | #300 | Tragic $41,051 |
| Immigrants | Latin America | 0.1 /100 | #301 | Tragic $41,049 |
| Shoshone | 0.0 /100 | #302 | Tragic $40,932 |
| Haitians | 0.0 /100 | #303 | Tragic $40,918 |
| Immigrants | Guatemala | 0.0 /100 | #304 | Tragic $40,851 |
| Chickasaw | 0.0 /100 | #305 | Tragic $40,672 |
| Yaqui | 0.0 /100 | #306 | Tragic $40,647 |
| Hondurans | 0.0 /100 | #307 | Tragic $40,638 |
| Cubans | 0.0 /100 | #308 | Tragic $40,619 |
| Immigrants | Haiti | 0.0 /100 | #309 | Tragic $40,550 |
Demographics Similar to Immigrants from Syria by Median Earnings
In terms of median earnings, the demographic groups most similar to Immigrants from Syria are Brazilian ($48,356, a difference of 0.040%), Immigrants from Fiji ($48,305, a difference of 0.14%), Assyrian/Chaldean/Syriac ($48,304, a difference of 0.15%), Sierra Leonean ($48,286, a difference of 0.19%), and Immigrants from Philippines ($48,266, a difference of 0.23%).
| Demographics | Rating | Rank | Median Earnings |
| Koreans | 96.2 /100 | #116 | Exceptional $48,727 |
| Serbians | 95.9 /100 | #117 | Exceptional $48,677 |
| Immigrants | Jordan | 95.9 /100 | #118 | Exceptional $48,673 |
| Poles | 95.8 /100 | #119 | Exceptional $48,659 |
| Carpatho Rusyns | 95.5 /100 | #120 | Exceptional $48,617 |
| Arabs | 95.4 /100 | #121 | Exceptional $48,599 |
| Chileans | 94.8 /100 | #122 | Exceptional $48,504 |
| Immigrants | Syria | 93.9 /100 | #123 | Exceptional $48,375 |
| Brazilians | 93.7 /100 | #124 | Exceptional $48,356 |
| Immigrants | Fiji | 93.3 /100 | #125 | Exceptional $48,305 |
| Assyrians/Chaldeans/Syriacs | 93.3 /100 | #126 | Exceptional $48,304 |
| Sierra Leoneans | 93.1 /100 | #127 | Exceptional $48,286 |
| Immigrants | Philippines | 92.9 /100 | #128 | Exceptional $48,266 |
| Pakistanis | 92.8 /100 | #129 | Exceptional $48,254 |
| Zimbabweans | 92.6 /100 | #130 | Exceptional $48,229 |