Tongan vs Immigrants from Afghanistan Median Earnings
COMPARE
Tongan
Immigrants from Afghanistan
Median Earnings
Median Earnings Comparison
Tongans
Immigrants from Afghanistan
$45,665
MEDIAN EARNINGS
25.4/ 100
METRIC RATING
205th/ 347
METRIC RANK
$49,645
MEDIAN EARNINGS
98.9/ 100
METRIC RATING
99th/ 347
METRIC RANK
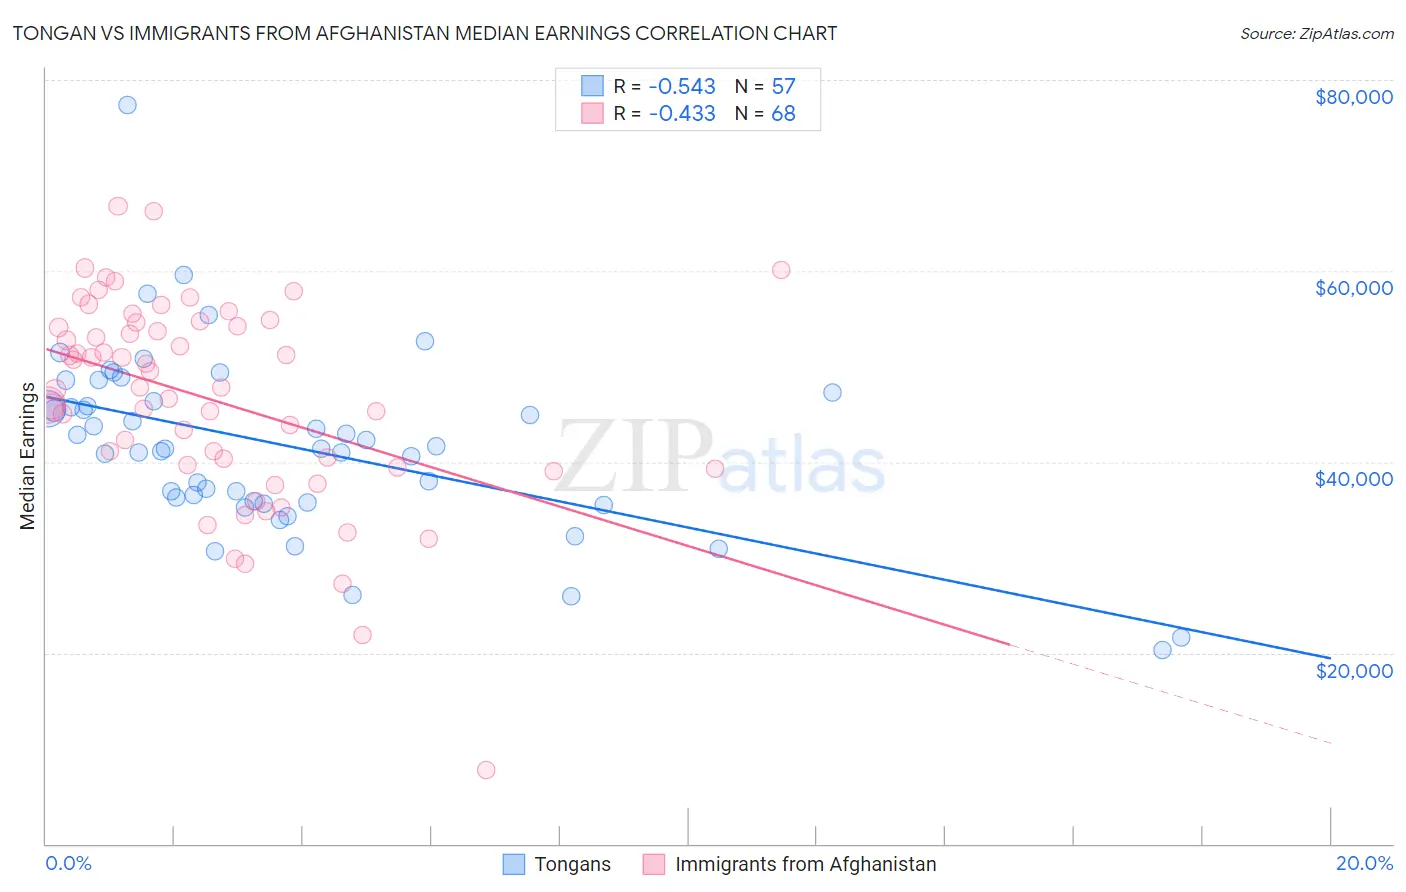
Tongan vs Immigrants from Afghanistan Median Earnings Correlation Chart
The statistical analysis conducted on geographies consisting of 102,906,626 people shows a substantial negative correlation between the proportion of Tongans and median earnings in the United States with a correlation coefficient (R) of -0.543 and weighted average of $45,665. Similarly, the statistical analysis conducted on geographies consisting of 147,645,000 people shows a moderate negative correlation between the proportion of Immigrants from Afghanistan and median earnings in the United States with a correlation coefficient (R) of -0.433 and weighted average of $49,645, a difference of 8.7%.
Median Earnings Correlation Summary
| Measurement | Tongan | Immigrants from Afghanistan |
| Minimum | $20,292 | $7,703 |
| Maximum | $77,441 | $66,757 |
| Range | $57,149 | $59,054 |
| Mean | $41,730 | $46,511 |
| Median | $41,421 | $47,775 |
| Interquartile 25% (IQ1) | $35,786 | $39,495 |
| Interquartile 75% (IQ3) | $46,789 | $54,376 |
| Interquartile Range (IQR) | $11,003 | $14,881 |
| Standard Deviation (Sample) | $9,523 | $10,763 |
| Standard Deviation (Population) | $9,439 | $10,683 |
Similar Demographics by Median Earnings
Demographics Similar to Tongans by Median Earnings
In terms of median earnings, the demographic groups most similar to Tongans are Immigrants from Uruguay ($45,682, a difference of 0.040%), Immigrants from Ghana ($45,641, a difference of 0.050%), Welsh ($45,710, a difference of 0.10%), Immigrants from Senegal ($45,611, a difference of 0.12%), and Immigrants from Trinidad and Tobago ($45,729, a difference of 0.14%).
| Demographics | Rating | Rank | Median Earnings |
| Trinidadians and Tobagonians | 29.7 /100 | #198 | Fair $45,820 |
| Immigrants | Barbados | 29.6 /100 | #199 | Fair $45,816 |
| Immigrants | Azores | 29.5 /100 | #200 | Fair $45,812 |
| Celtics | 27.2 /100 | #201 | Fair $45,732 |
| Immigrants | Trinidad and Tobago | 27.1 /100 | #202 | Fair $45,729 |
| Welsh | 26.6 /100 | #203 | Fair $45,710 |
| Immigrants | Uruguay | 25.9 /100 | #204 | Fair $45,682 |
| Tongans | 25.4 /100 | #205 | Fair $45,665 |
| Immigrants | Ghana | 24.8 /100 | #206 | Fair $45,641 |
| Immigrants | Senegal | 24.0 /100 | #207 | Fair $45,611 |
| Immigrants | Bosnia and Herzegovina | 23.7 /100 | #208 | Fair $45,600 |
| Immigrants | Thailand | 23.7 /100 | #209 | Fair $45,598 |
| Immigrants | Grenada | 23.6 /100 | #210 | Fair $45,596 |
| Panamanians | 23.5 /100 | #211 | Fair $45,593 |
| Bermudans | 23.5 /100 | #212 | Fair $45,593 |
Demographics Similar to Immigrants from Afghanistan by Median Earnings
In terms of median earnings, the demographic groups most similar to Immigrants from Afghanistan are Immigrants from Northern Africa ($49,648, a difference of 0.010%), Immigrants from Poland ($49,633, a difference of 0.020%), Immigrants from North Macedonia ($49,658, a difference of 0.030%), Jordanian ($49,632, a difference of 0.030%), and Immigrants from Lebanon ($49,682, a difference of 0.070%).
| Demographics | Rating | Rank | Median Earnings |
| Immigrants | Argentina | 99.2 /100 | #92 | Exceptional $49,841 |
| Armenians | 99.1 /100 | #93 | Exceptional $49,804 |
| Croatians | 99.0 /100 | #94 | Exceptional $49,724 |
| Immigrants | England | 99.0 /100 | #95 | Exceptional $49,722 |
| Immigrants | Lebanon | 99.0 /100 | #96 | Exceptional $49,682 |
| Immigrants | North Macedonia | 98.9 /100 | #97 | Exceptional $49,658 |
| Immigrants | Northern Africa | 98.9 /100 | #98 | Exceptional $49,648 |
| Immigrants | Afghanistan | 98.9 /100 | #99 | Exceptional $49,645 |
| Immigrants | Poland | 98.9 /100 | #100 | Exceptional $49,633 |
| Jordanians | 98.9 /100 | #101 | Exceptional $49,632 |
| Ethiopians | 98.8 /100 | #102 | Exceptional $49,572 |
| Austrians | 98.7 /100 | #103 | Exceptional $49,501 |
| Immigrants | Brazil | 98.6 /100 | #104 | Exceptional $49,463 |
| Immigrants | Western Asia | 98.4 /100 | #105 | Exceptional $49,389 |
| Immigrants | Albania | 98.4 /100 | #106 | Exceptional $49,377 |