Somali vs Ukrainian Median Household Income
COMPARE
Somali
Ukrainian
Median Household Income
Median Household Income Comparison
Somalis
Ukrainians
$75,782
MEDIAN HOUSEHOLD INCOME
0.3/ 100
METRIC RATING
272nd/ 347
METRIC RANK
$91,456
MEDIAN HOUSEHOLD INCOME
98.3/ 100
METRIC RATING
100th/ 347
METRIC RANK
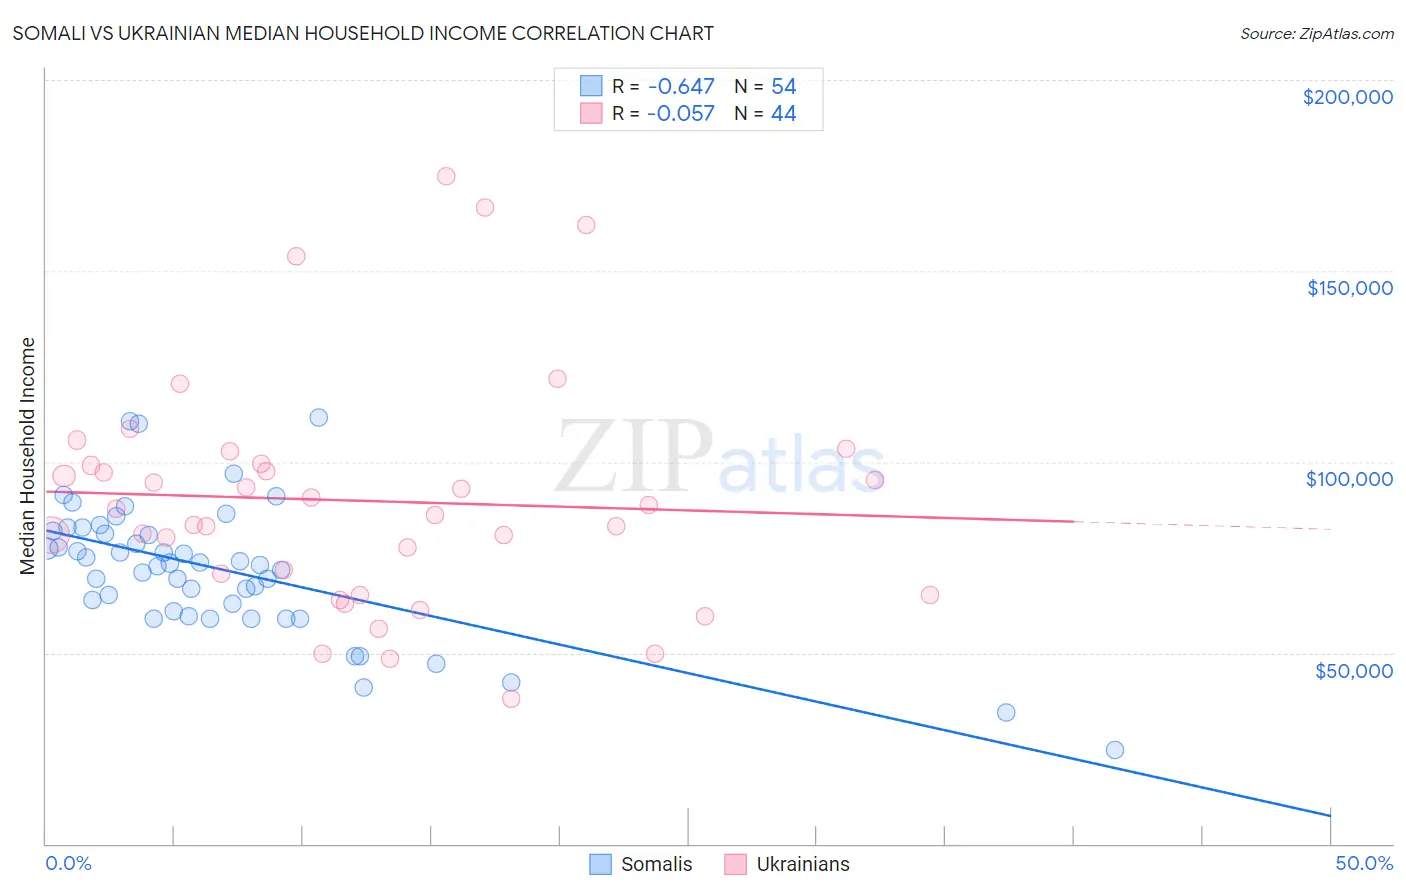
Somali vs Ukrainian Median Household Income Correlation Chart
The statistical analysis conducted on geographies consisting of 99,284,368 people shows a significant negative correlation between the proportion of Somalis and median household income in the United States with a correlation coefficient (R) of -0.647 and weighted average of $75,782. Similarly, the statistical analysis conducted on geographies consisting of 448,198,646 people shows a slight negative correlation between the proportion of Ukrainians and median household income in the United States with a correlation coefficient (R) of -0.057 and weighted average of $91,456, a difference of 20.7%.
Median Household Income Correlation Summary
| Measurement | Somali | Ukrainian |
| Minimum | $24,660 | $37,811 |
| Maximum | $111,550 | $174,670 |
| Range | $86,890 | $136,859 |
| Mean | $71,854 | $89,793 |
| Median | $73,292 | $86,791 |
| Interquartile 25% (IQ1) | $60,808 | $67,812 |
| Interquartile 75% (IQ3) | $81,847 | $99,299 |
| Interquartile Range (IQR) | $21,039 | $31,486 |
| Standard Deviation (Sample) | $17,515 | $30,572 |
| Standard Deviation (Population) | $17,352 | $30,223 |
Similar Demographics by Median Household Income
Demographics Similar to Somalis by Median Household Income
In terms of median household income, the demographic groups most similar to Somalis are Pennsylvania German ($75,814, a difference of 0.040%), Hmong ($75,839, a difference of 0.080%), Immigrants from Jamaica ($75,851, a difference of 0.090%), Cape Verdean ($75,848, a difference of 0.090%), and German Russian ($75,856, a difference of 0.10%).
| Demographics | Rating | Rank | Median Household Income |
| Immigrants | Belize | 0.3 /100 | #265 | Tragic $75,938 |
| Americans | 0.3 /100 | #266 | Tragic $75,932 |
| German Russians | 0.3 /100 | #267 | Tragic $75,856 |
| Immigrants | Jamaica | 0.3 /100 | #268 | Tragic $75,851 |
| Cape Verdeans | 0.3 /100 | #269 | Tragic $75,848 |
| Hmong | 0.3 /100 | #270 | Tragic $75,839 |
| Pennsylvania Germans | 0.3 /100 | #271 | Tragic $75,814 |
| Somalis | 0.3 /100 | #272 | Tragic $75,782 |
| Liberians | 0.2 /100 | #273 | Tragic $75,667 |
| British West Indians | 0.2 /100 | #274 | Tragic $75,647 |
| Immigrants | Micronesia | 0.2 /100 | #275 | Tragic $75,574 |
| Immigrants | Latin America | 0.2 /100 | #276 | Tragic $75,420 |
| Spanish Americans | 0.2 /100 | #277 | Tragic $75,386 |
| Osage | 0.2 /100 | #278 | Tragic $75,240 |
| Immigrants | Guatemala | 0.2 /100 | #279 | Tragic $75,123 |
Demographics Similar to Ukrainians by Median Household Income
In terms of median household income, the demographic groups most similar to Ukrainians are Immigrants from Moldova ($91,446, a difference of 0.010%), Immigrants from South Eastern Asia ($91,541, a difference of 0.090%), Austrian ($91,339, a difference of 0.13%), Immigrants from Southern Europe ($91,605, a difference of 0.16%), and Immigrants from Serbia ($91,730, a difference of 0.30%).
| Demographics | Rating | Rank | Median Household Income |
| Immigrants | Lebanon | 98.7 /100 | #93 | Exceptional $91,887 |
| Immigrants | North America | 98.7 /100 | #94 | Exceptional $91,860 |
| Armenians | 98.7 /100 | #95 | Exceptional $91,807 |
| Jordanians | 98.7 /100 | #96 | Exceptional $91,794 |
| Immigrants | Serbia | 98.6 /100 | #97 | Exceptional $91,730 |
| Immigrants | Southern Europe | 98.5 /100 | #98 | Exceptional $91,605 |
| Immigrants | South Eastern Asia | 98.4 /100 | #99 | Exceptional $91,541 |
| Ukrainians | 98.3 /100 | #100 | Exceptional $91,456 |
| Immigrants | Moldova | 98.3 /100 | #101 | Exceptional $91,446 |
| Austrians | 98.2 /100 | #102 | Exceptional $91,339 |
| Immigrants | Ukraine | 98.0 /100 | #103 | Exceptional $91,124 |
| Immigrants | Kazakhstan | 97.8 /100 | #104 | Exceptional $91,015 |
| Immigrants | Brazil | 97.7 /100 | #105 | Exceptional $90,907 |
| Macedonians | 97.4 /100 | #106 | Exceptional $90,761 |
| Croatians | 97.3 /100 | #107 | Exceptional $90,685 |