Czech vs Ukrainian Median Household Income
COMPARE
Czech
Ukrainian
Median Household Income
Median Household Income Comparison
Czechs
Ukrainians
$86,164
MEDIAN HOUSEHOLD INCOME
66.4/ 100
METRIC RATING
163rd/ 347
METRIC RANK
$91,456
MEDIAN HOUSEHOLD INCOME
98.3/ 100
METRIC RATING
100th/ 347
METRIC RANK
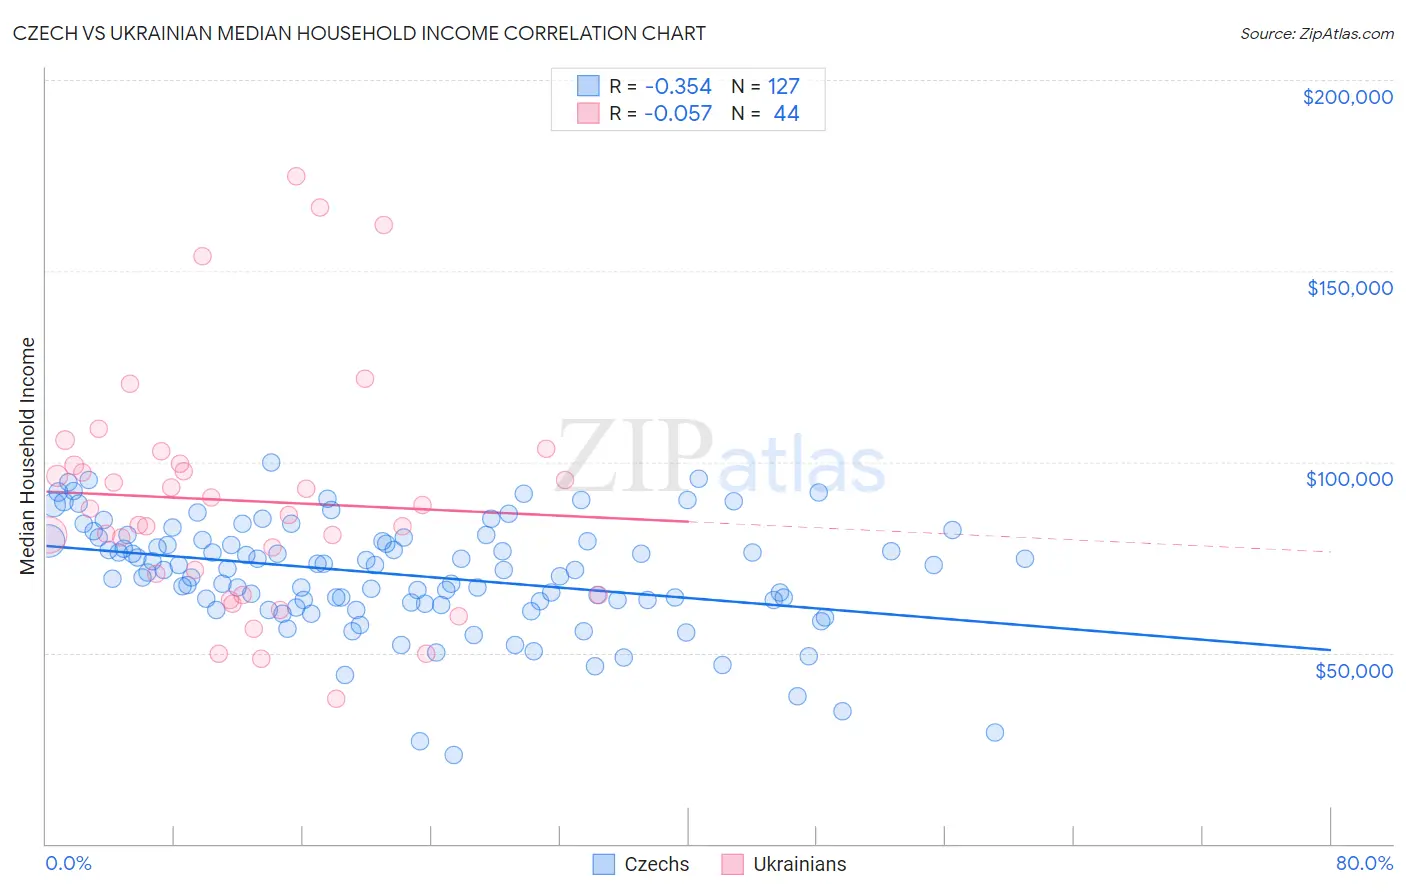
Czech vs Ukrainian Median Household Income Correlation Chart
The statistical analysis conducted on geographies consisting of 484,294,688 people shows a mild negative correlation between the proportion of Czechs and median household income in the United States with a correlation coefficient (R) of -0.354 and weighted average of $86,164. Similarly, the statistical analysis conducted on geographies consisting of 448,198,646 people shows a slight negative correlation between the proportion of Ukrainians and median household income in the United States with a correlation coefficient (R) of -0.057 and weighted average of $91,456, a difference of 6.1%.
Median Household Income Correlation Summary
| Measurement | Czech | Ukrainian |
| Minimum | $23,393 | $37,811 |
| Maximum | $99,887 | $174,670 |
| Range | $76,494 | $136,859 |
| Mean | $70,465 | $89,793 |
| Median | $71,750 | $86,791 |
| Interquartile 25% (IQ1) | $63,125 | $67,812 |
| Interquartile 75% (IQ3) | $79,521 | $99,299 |
| Interquartile Range (IQR) | $16,396 | $31,486 |
| Standard Deviation (Sample) | $14,479 | $30,572 |
| Standard Deviation (Population) | $14,422 | $30,223 |
Similar Demographics by Median Household Income
Demographics Similar to Czechs by Median Household Income
In terms of median household income, the demographic groups most similar to Czechs are Irish ($86,145, a difference of 0.020%), Norwegian ($86,084, a difference of 0.090%), Guamanian/Chamorro ($86,255, a difference of 0.11%), Scandinavian ($86,073, a difference of 0.11%), and Slavic ($86,398, a difference of 0.27%).
| Demographics | Rating | Rank | Median Household Income |
| Immigrants | Albania | 71.5 /100 | #156 | Good $86,534 |
| Samoans | 71.0 /100 | #157 | Good $86,498 |
| Moroccans | 70.6 /100 | #158 | Good $86,468 |
| Immigrants | Uzbekistan | 70.1 /100 | #159 | Good $86,425 |
| Luxembourgers | 70.0 /100 | #160 | Good $86,418 |
| Slavs | 69.7 /100 | #161 | Good $86,398 |
| Guamanians/Chamorros | 67.7 /100 | #162 | Good $86,255 |
| Czechs | 66.4 /100 | #163 | Good $86,164 |
| Irish | 66.2 /100 | #164 | Good $86,145 |
| Norwegians | 65.3 /100 | #165 | Good $86,084 |
| Scandinavians | 65.1 /100 | #166 | Good $86,073 |
| Immigrants | Immigrants | 61.3 /100 | #167 | Good $85,818 |
| Icelanders | 61.0 /100 | #168 | Good $85,797 |
| Colombians | 59.7 /100 | #169 | Average $85,716 |
| Swiss | 59.2 /100 | #170 | Average $85,681 |
Demographics Similar to Ukrainians by Median Household Income
In terms of median household income, the demographic groups most similar to Ukrainians are Immigrants from Moldova ($91,446, a difference of 0.010%), Immigrants from South Eastern Asia ($91,541, a difference of 0.090%), Austrian ($91,339, a difference of 0.13%), Immigrants from Southern Europe ($91,605, a difference of 0.16%), and Immigrants from Serbia ($91,730, a difference of 0.30%).
| Demographics | Rating | Rank | Median Household Income |
| Immigrants | Lebanon | 98.7 /100 | #93 | Exceptional $91,887 |
| Immigrants | North America | 98.7 /100 | #94 | Exceptional $91,860 |
| Armenians | 98.7 /100 | #95 | Exceptional $91,807 |
| Jordanians | 98.7 /100 | #96 | Exceptional $91,794 |
| Immigrants | Serbia | 98.6 /100 | #97 | Exceptional $91,730 |
| Immigrants | Southern Europe | 98.5 /100 | #98 | Exceptional $91,605 |
| Immigrants | South Eastern Asia | 98.4 /100 | #99 | Exceptional $91,541 |
| Ukrainians | 98.3 /100 | #100 | Exceptional $91,456 |
| Immigrants | Moldova | 98.3 /100 | #101 | Exceptional $91,446 |
| Austrians | 98.2 /100 | #102 | Exceptional $91,339 |
| Immigrants | Ukraine | 98.0 /100 | #103 | Exceptional $91,124 |
| Immigrants | Kazakhstan | 97.8 /100 | #104 | Exceptional $91,015 |
| Immigrants | Brazil | 97.7 /100 | #105 | Exceptional $90,907 |
| Macedonians | 97.4 /100 | #106 | Exceptional $90,761 |
| Croatians | 97.3 /100 | #107 | Exceptional $90,685 |