Colville vs Ukrainian Median Household Income
COMPARE
Colville
Ukrainian
Median Household Income
Median Household Income Comparison
Colville
Ukrainians
$70,094
MEDIAN HOUSEHOLD INCOME
0.0/ 100
METRIC RATING
320th/ 347
METRIC RANK
$91,456
MEDIAN HOUSEHOLD INCOME
98.3/ 100
METRIC RATING
100th/ 347
METRIC RANK
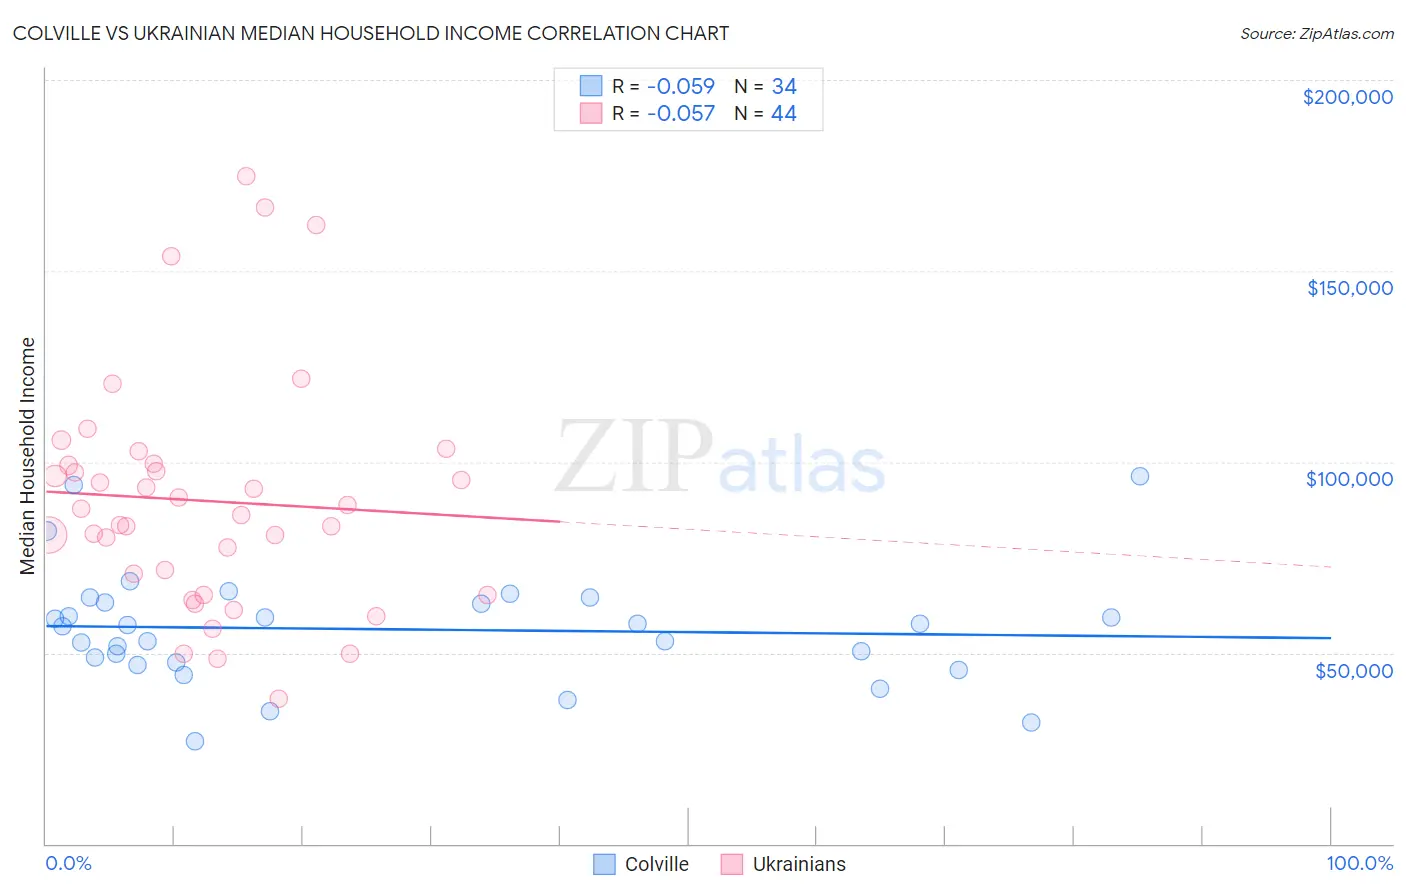
Colville vs Ukrainian Median Household Income Correlation Chart
The statistical analysis conducted on geographies consisting of 34,681,598 people shows a slight negative correlation between the proportion of Colville and median household income in the United States with a correlation coefficient (R) of -0.059 and weighted average of $70,094. Similarly, the statistical analysis conducted on geographies consisting of 448,198,646 people shows a slight negative correlation between the proportion of Ukrainians and median household income in the United States with a correlation coefficient (R) of -0.057 and weighted average of $91,456, a difference of 30.5%.
Median Household Income Correlation Summary
| Measurement | Colville | Ukrainian |
| Minimum | $26,823 | $37,811 |
| Maximum | $96,250 | $174,670 |
| Range | $69,427 | $136,859 |
| Mean | $56,145 | $89,793 |
| Median | $57,218 | $86,791 |
| Interquartile 25% (IQ1) | $47,361 | $67,812 |
| Interquartile 75% (IQ3) | $63,313 | $99,299 |
| Interquartile Range (IQR) | $15,952 | $31,486 |
| Standard Deviation (Sample) | $14,989 | $30,572 |
| Standard Deviation (Population) | $14,767 | $30,223 |
Similar Demographics by Median Household Income
Demographics Similar to Colville by Median Household Income
In terms of median household income, the demographic groups most similar to Colville are Chickasaw ($70,005, a difference of 0.13%), Immigrants from Dominican Republic ($70,208, a difference of 0.16%), Choctaw ($69,947, a difference of 0.21%), Bahamian ($69,726, a difference of 0.53%), and Yup'ik ($69,695, a difference of 0.57%).
| Demographics | Rating | Rank | Median Household Income |
| Immigrants | Bahamas | 0.0 /100 | #313 | Tragic $71,349 |
| Dominicans | 0.0 /100 | #314 | Tragic $71,302 |
| Ottawa | 0.0 /100 | #315 | Tragic $70,984 |
| Apache | 0.0 /100 | #316 | Tragic $70,927 |
| Cajuns | 0.0 /100 | #317 | Tragic $70,605 |
| Chippewa | 0.0 /100 | #318 | Tragic $70,539 |
| Immigrants | Dominican Republic | 0.0 /100 | #319 | Tragic $70,208 |
| Colville | 0.0 /100 | #320 | Tragic $70,094 |
| Chickasaw | 0.0 /100 | #321 | Tragic $70,005 |
| Choctaw | 0.0 /100 | #322 | Tragic $69,947 |
| Bahamians | 0.0 /100 | #323 | Tragic $69,726 |
| Yup'ik | 0.0 /100 | #324 | Tragic $69,695 |
| Seminole | 0.0 /100 | #325 | Tragic $69,420 |
| Yuman | 0.0 /100 | #326 | Tragic $68,743 |
| Immigrants | Cuba | 0.0 /100 | #327 | Tragic $68,461 |
Demographics Similar to Ukrainians by Median Household Income
In terms of median household income, the demographic groups most similar to Ukrainians are Immigrants from Moldova ($91,446, a difference of 0.010%), Immigrants from South Eastern Asia ($91,541, a difference of 0.090%), Austrian ($91,339, a difference of 0.13%), Immigrants from Southern Europe ($91,605, a difference of 0.16%), and Immigrants from Serbia ($91,730, a difference of 0.30%).
| Demographics | Rating | Rank | Median Household Income |
| Immigrants | Lebanon | 98.7 /100 | #93 | Exceptional $91,887 |
| Immigrants | North America | 98.7 /100 | #94 | Exceptional $91,860 |
| Armenians | 98.7 /100 | #95 | Exceptional $91,807 |
| Jordanians | 98.7 /100 | #96 | Exceptional $91,794 |
| Immigrants | Serbia | 98.6 /100 | #97 | Exceptional $91,730 |
| Immigrants | Southern Europe | 98.5 /100 | #98 | Exceptional $91,605 |
| Immigrants | South Eastern Asia | 98.4 /100 | #99 | Exceptional $91,541 |
| Ukrainians | 98.3 /100 | #100 | Exceptional $91,456 |
| Immigrants | Moldova | 98.3 /100 | #101 | Exceptional $91,446 |
| Austrians | 98.2 /100 | #102 | Exceptional $91,339 |
| Immigrants | Ukraine | 98.0 /100 | #103 | Exceptional $91,124 |
| Immigrants | Kazakhstan | 97.8 /100 | #104 | Exceptional $91,015 |
| Immigrants | Brazil | 97.7 /100 | #105 | Exceptional $90,907 |
| Macedonians | 97.4 /100 | #106 | Exceptional $90,761 |
| Croatians | 97.3 /100 | #107 | Exceptional $90,685 |