Immigrants from Saudi Arabia vs Immigrants from Syria Median Earnings
COMPARE
Immigrants from Saudi Arabia
Immigrants from Syria
Median Earnings
Median Earnings Comparison
Immigrants from Saudi Arabia
Immigrants from Syria
$47,704
MEDIAN EARNINGS
85.6/ 100
METRIC RATING
145th/ 347
METRIC RANK
$48,375
MEDIAN EARNINGS
93.9/ 100
METRIC RATING
123rd/ 347
METRIC RANK
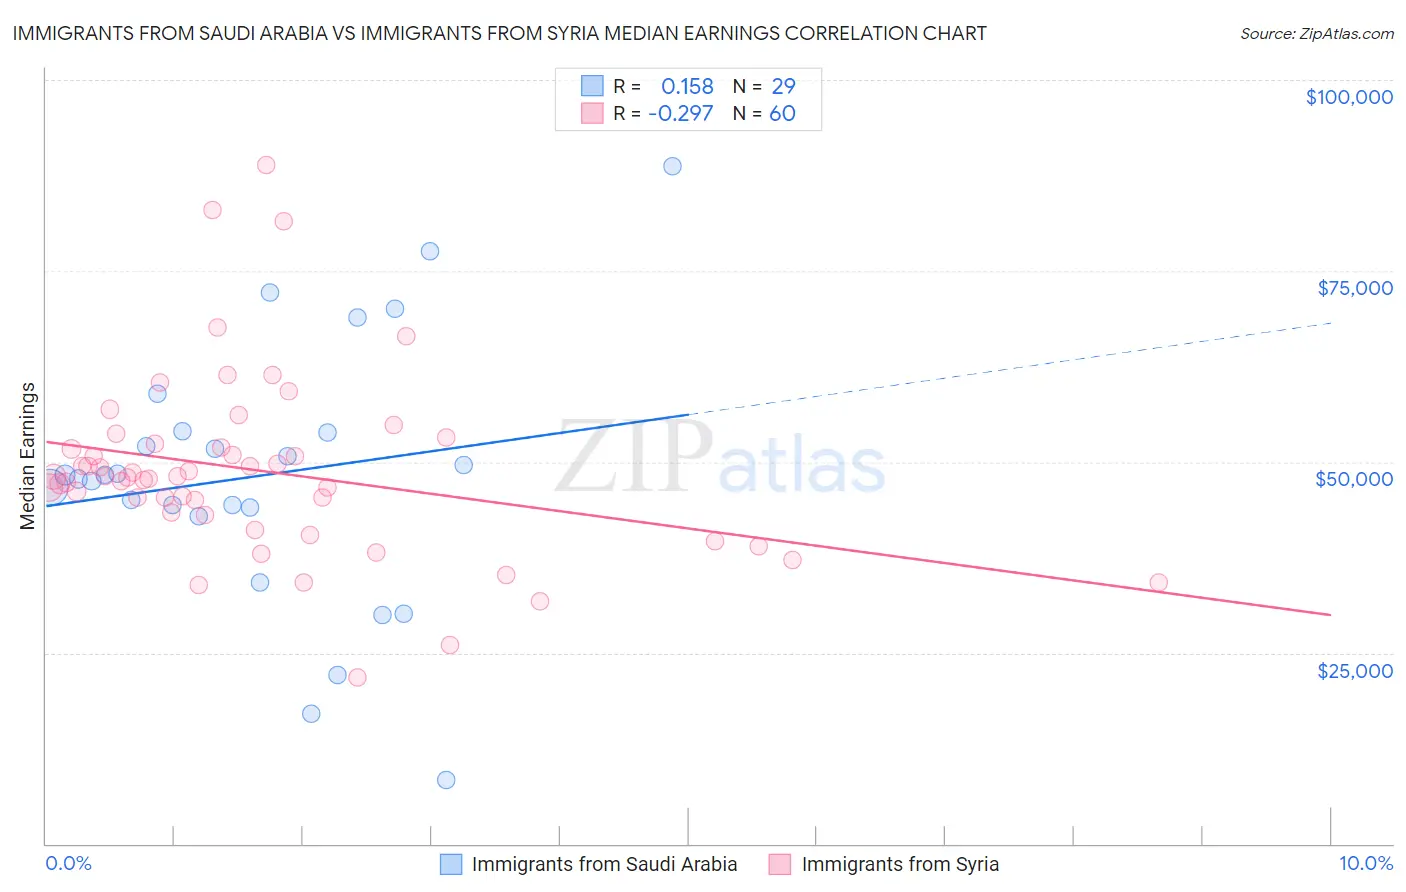
Immigrants from Saudi Arabia vs Immigrants from Syria Median Earnings Correlation Chart
The statistical analysis conducted on geographies consisting of 164,295,886 people shows a poor positive correlation between the proportion of Immigrants from Saudi Arabia and median earnings in the United States with a correlation coefficient (R) of 0.158 and weighted average of $47,704. Similarly, the statistical analysis conducted on geographies consisting of 174,102,272 people shows a weak negative correlation between the proportion of Immigrants from Syria and median earnings in the United States with a correlation coefficient (R) of -0.297 and weighted average of $48,375, a difference of 1.4%.
Median Earnings Correlation Summary
| Measurement | Immigrants from Saudi Arabia | Immigrants from Syria |
| Minimum | $8,283 | $21,696 |
| Maximum | $88,678 | $88,902 |
| Range | $80,395 | $67,206 |
| Mean | $48,188 | $48,829 |
| Median | $48,225 | $48,019 |
| Interquartile 25% (IQ1) | $43,477 | $43,163 |
| Interquartile 75% (IQ3) | $53,983 | $52,131 |
| Interquartile Range (IQR) | $10,507 | $8,968 |
| Standard Deviation (Sample) | $17,307 | $12,024 |
| Standard Deviation (Population) | $17,006 | $11,923 |
Similar Demographics by Median Earnings
Demographics Similar to Immigrants from Saudi Arabia by Median Earnings
In terms of median earnings, the demographic groups most similar to Immigrants from Saudi Arabia are Immigrants from Chile ($47,697, a difference of 0.010%), Immigrants from South Eastern Asia ($47,671, a difference of 0.070%), Immigrants from Eritrea ($47,657, a difference of 0.10%), Luxembourger ($47,640, a difference of 0.14%), and Peruvian ($47,628, a difference of 0.16%).
| Demographics | Rating | Rank | Median Earnings |
| Europeans | 88.9 /100 | #138 | Excellent $47,915 |
| Canadians | 88.8 /100 | #139 | Excellent $47,911 |
| Taiwanese | 88.7 /100 | #140 | Excellent $47,902 |
| Immigrants | Sierra Leone | 88.3 /100 | #141 | Excellent $47,875 |
| Ugandans | 88.0 /100 | #142 | Excellent $47,854 |
| Swedes | 88.0 /100 | #143 | Excellent $47,851 |
| Hungarians | 87.1 /100 | #144 | Excellent $47,795 |
| Immigrants | Saudi Arabia | 85.6 /100 | #145 | Excellent $47,704 |
| Immigrants | Chile | 85.5 /100 | #146 | Excellent $47,697 |
| Immigrants | South Eastern Asia | 85.0 /100 | #147 | Excellent $47,671 |
| Immigrants | Eritrea | 84.8 /100 | #148 | Excellent $47,657 |
| Luxembourgers | 84.5 /100 | #149 | Excellent $47,640 |
| Peruvians | 84.2 /100 | #150 | Excellent $47,628 |
| Immigrants | Oceania | 84.1 /100 | #151 | Excellent $47,617 |
| Immigrants | Germany | 83.1 /100 | #152 | Excellent $47,566 |
Demographics Similar to Immigrants from Syria by Median Earnings
In terms of median earnings, the demographic groups most similar to Immigrants from Syria are Brazilian ($48,356, a difference of 0.040%), Immigrants from Fiji ($48,305, a difference of 0.14%), Assyrian/Chaldean/Syriac ($48,304, a difference of 0.15%), Sierra Leonean ($48,286, a difference of 0.19%), and Immigrants from Philippines ($48,266, a difference of 0.23%).
| Demographics | Rating | Rank | Median Earnings |
| Koreans | 96.2 /100 | #116 | Exceptional $48,727 |
| Serbians | 95.9 /100 | #117 | Exceptional $48,677 |
| Immigrants | Jordan | 95.9 /100 | #118 | Exceptional $48,673 |
| Poles | 95.8 /100 | #119 | Exceptional $48,659 |
| Carpatho Rusyns | 95.5 /100 | #120 | Exceptional $48,617 |
| Arabs | 95.4 /100 | #121 | Exceptional $48,599 |
| Chileans | 94.8 /100 | #122 | Exceptional $48,504 |
| Immigrants | Syria | 93.9 /100 | #123 | Exceptional $48,375 |
| Brazilians | 93.7 /100 | #124 | Exceptional $48,356 |
| Immigrants | Fiji | 93.3 /100 | #125 | Exceptional $48,305 |
| Assyrians/Chaldeans/Syriacs | 93.3 /100 | #126 | Exceptional $48,304 |
| Sierra Leoneans | 93.1 /100 | #127 | Exceptional $48,286 |
| Immigrants | Philippines | 92.9 /100 | #128 | Exceptional $48,266 |
| Pakistanis | 92.8 /100 | #129 | Exceptional $48,254 |
| Zimbabweans | 92.6 /100 | #130 | Exceptional $48,229 |