Immigrants from Central America vs Immigrants from Syria Median Earnings
COMPARE
Immigrants from Central America
Immigrants from Syria
Median Earnings
Median Earnings Comparison
Immigrants from Central America
Immigrants from Syria
$39,762
MEDIAN EARNINGS
0.0/ 100
METRIC RATING
322nd/ 347
METRIC RANK
$48,375
MEDIAN EARNINGS
93.9/ 100
METRIC RATING
123rd/ 347
METRIC RANK
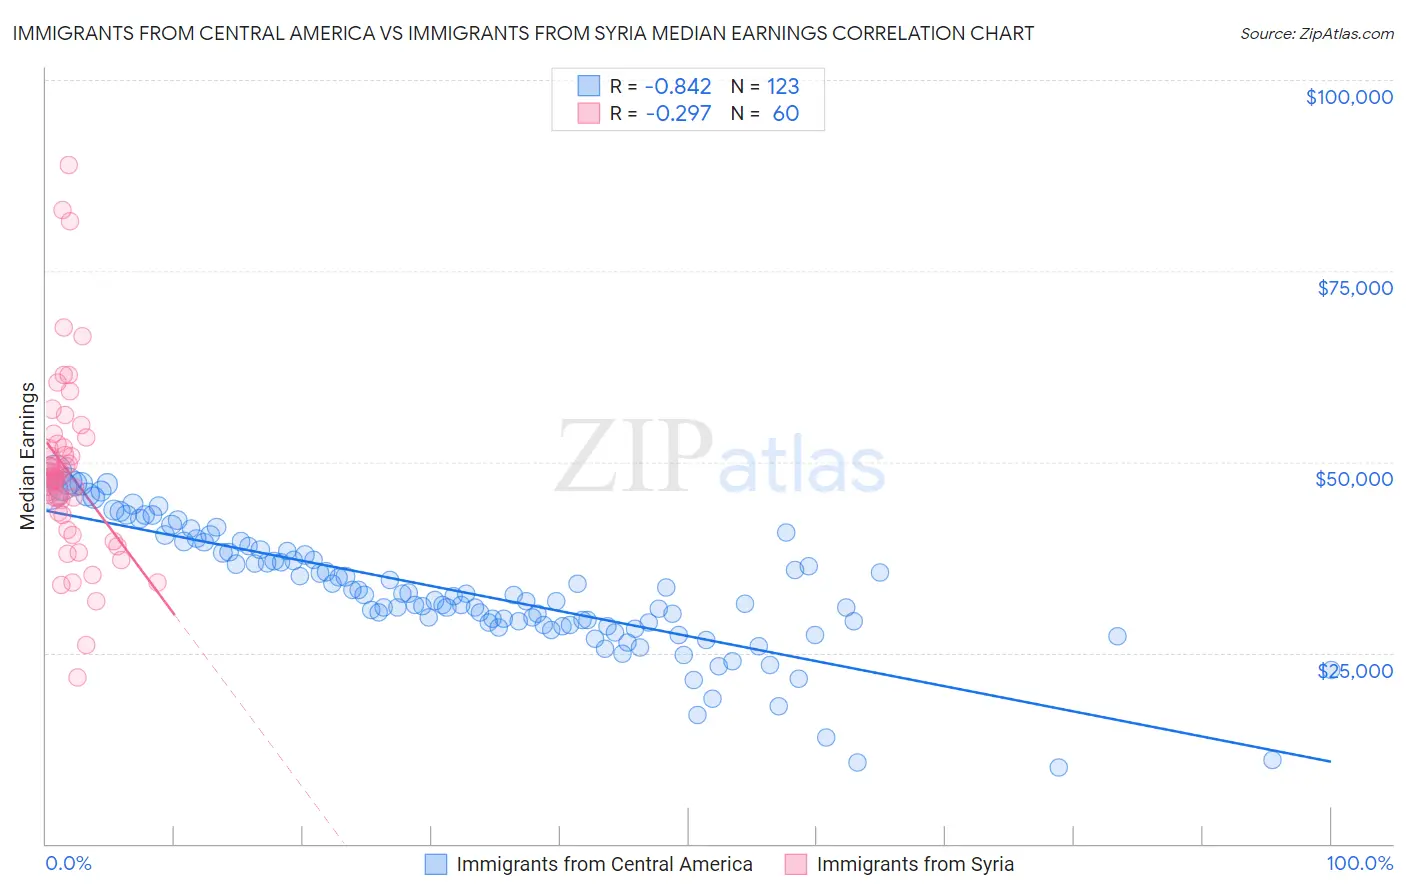
Immigrants from Central America vs Immigrants from Syria Median Earnings Correlation Chart
The statistical analysis conducted on geographies consisting of 536,322,180 people shows a very strong negative correlation between the proportion of Immigrants from Central America and median earnings in the United States with a correlation coefficient (R) of -0.842 and weighted average of $39,762. Similarly, the statistical analysis conducted on geographies consisting of 174,102,272 people shows a weak negative correlation between the proportion of Immigrants from Syria and median earnings in the United States with a correlation coefficient (R) of -0.297 and weighted average of $48,375, a difference of 21.7%.
Median Earnings Correlation Summary
| Measurement | Immigrants from Central America | Immigrants from Syria |
| Minimum | $9,917 | $21,696 |
| Maximum | $48,696 | $88,902 |
| Range | $38,779 | $67,206 |
| Mean | $33,043 | $48,829 |
| Median | $32,380 | $48,019 |
| Interquartile 25% (IQ1) | $28,620 | $43,163 |
| Interquartile 75% (IQ3) | $38,496 | $52,131 |
| Interquartile Range (IQR) | $9,875 | $8,968 |
| Standard Deviation (Sample) | $8,045 | $12,024 |
| Standard Deviation (Population) | $8,012 | $11,923 |
Similar Demographics by Median Earnings
Demographics Similar to Immigrants from Central America by Median Earnings
In terms of median earnings, the demographic groups most similar to Immigrants from Central America are Bahamian ($39,735, a difference of 0.070%), Ottawa ($39,721, a difference of 0.10%), Mexican ($39,834, a difference of 0.18%), Immigrants from Bahamas ($39,861, a difference of 0.25%), and Creek ($39,648, a difference of 0.29%).
| Demographics | Rating | Rank | Median Earnings |
| Seminole | 0.0 /100 | #315 | Tragic $40,233 |
| Immigrants | Honduras | 0.0 /100 | #316 | Tragic $40,195 |
| Fijians | 0.0 /100 | #317 | Tragic $40,193 |
| Dutch West Indians | 0.0 /100 | #318 | Tragic $40,107 |
| Blacks/African Americans | 0.0 /100 | #319 | Tragic $40,085 |
| Immigrants | Bahamas | 0.0 /100 | #320 | Tragic $39,861 |
| Mexicans | 0.0 /100 | #321 | Tragic $39,834 |
| Immigrants | Central America | 0.0 /100 | #322 | Tragic $39,762 |
| Bahamians | 0.0 /100 | #323 | Tragic $39,735 |
| Ottawa | 0.0 /100 | #324 | Tragic $39,721 |
| Creek | 0.0 /100 | #325 | Tragic $39,648 |
| Immigrants | Yemen | 0.0 /100 | #326 | Tragic $39,540 |
| Yuman | 0.0 /100 | #327 | Tragic $39,523 |
| Sioux | 0.0 /100 | #328 | Tragic $39,448 |
| Kiowa | 0.0 /100 | #329 | Tragic $39,232 |
Demographics Similar to Immigrants from Syria by Median Earnings
In terms of median earnings, the demographic groups most similar to Immigrants from Syria are Brazilian ($48,356, a difference of 0.040%), Immigrants from Fiji ($48,305, a difference of 0.14%), Assyrian/Chaldean/Syriac ($48,304, a difference of 0.15%), Sierra Leonean ($48,286, a difference of 0.19%), and Immigrants from Philippines ($48,266, a difference of 0.23%).
| Demographics | Rating | Rank | Median Earnings |
| Koreans | 96.2 /100 | #116 | Exceptional $48,727 |
| Serbians | 95.9 /100 | #117 | Exceptional $48,677 |
| Immigrants | Jordan | 95.9 /100 | #118 | Exceptional $48,673 |
| Poles | 95.8 /100 | #119 | Exceptional $48,659 |
| Carpatho Rusyns | 95.5 /100 | #120 | Exceptional $48,617 |
| Arabs | 95.4 /100 | #121 | Exceptional $48,599 |
| Chileans | 94.8 /100 | #122 | Exceptional $48,504 |
| Immigrants | Syria | 93.9 /100 | #123 | Exceptional $48,375 |
| Brazilians | 93.7 /100 | #124 | Exceptional $48,356 |
| Immigrants | Fiji | 93.3 /100 | #125 | Exceptional $48,305 |
| Assyrians/Chaldeans/Syriacs | 93.3 /100 | #126 | Exceptional $48,304 |
| Sierra Leoneans | 93.1 /100 | #127 | Exceptional $48,286 |
| Immigrants | Philippines | 92.9 /100 | #128 | Exceptional $48,266 |
| Pakistanis | 92.8 /100 | #129 | Exceptional $48,254 |
| Zimbabweans | 92.6 /100 | #130 | Exceptional $48,229 |