Cajun vs Immigrants from Syria Median Earnings
COMPARE
Cajun
Immigrants from Syria
Median Earnings
Median Earnings Comparison
Cajuns
Immigrants from Syria
$42,189
MEDIAN EARNINGS
0.3/ 100
METRIC RATING
278th/ 347
METRIC RANK
$48,375
MEDIAN EARNINGS
93.9/ 100
METRIC RATING
123rd/ 347
METRIC RANK
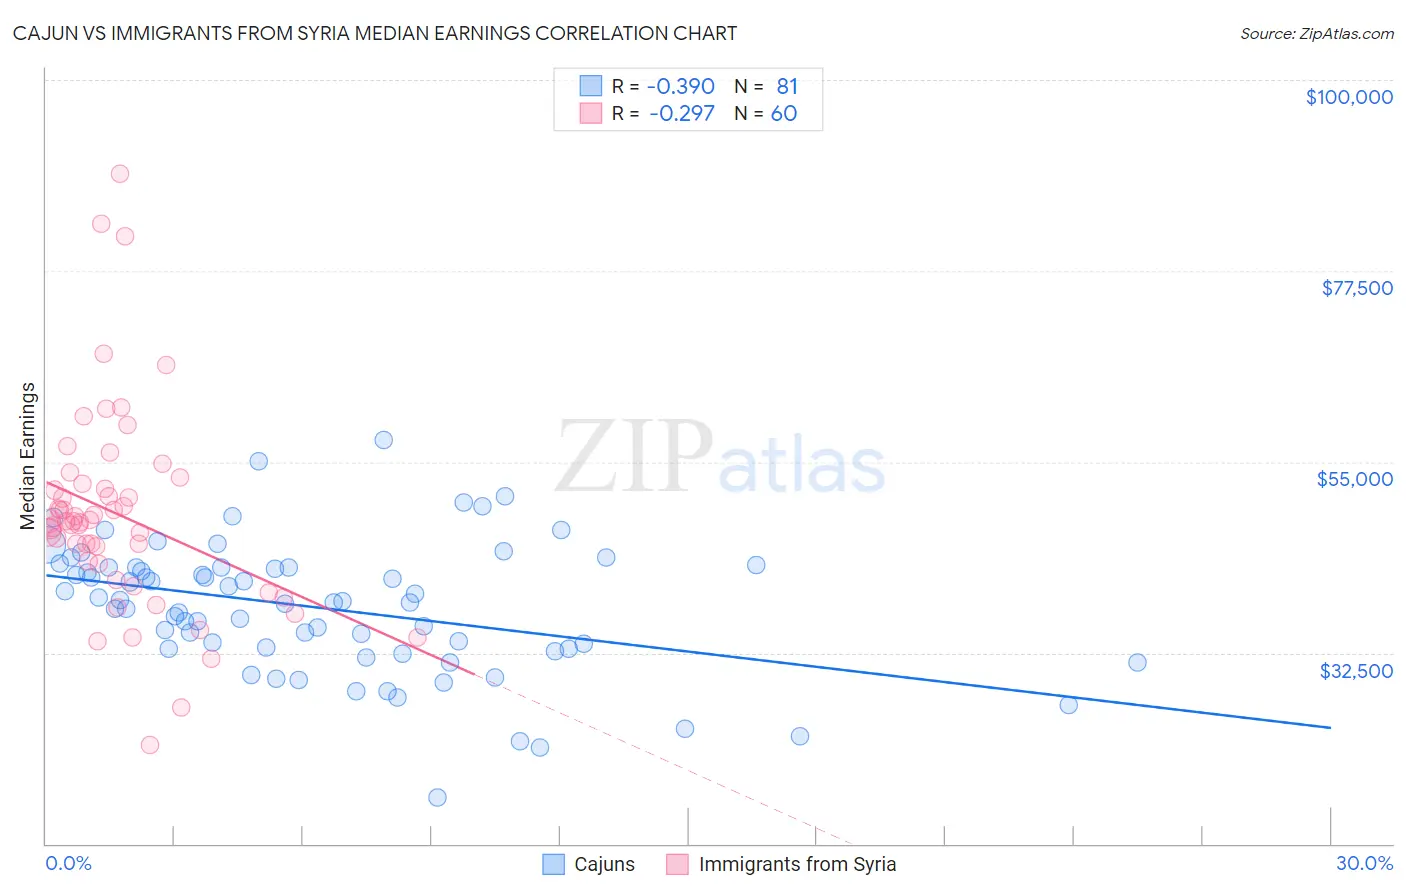
Cajun vs Immigrants from Syria Median Earnings Correlation Chart
The statistical analysis conducted on geographies consisting of 149,692,940 people shows a mild negative correlation between the proportion of Cajuns and median earnings in the United States with a correlation coefficient (R) of -0.390 and weighted average of $42,189. Similarly, the statistical analysis conducted on geographies consisting of 174,102,272 people shows a weak negative correlation between the proportion of Immigrants from Syria and median earnings in the United States with a correlation coefficient (R) of -0.297 and weighted average of $48,375, a difference of 14.7%.
Median Earnings Correlation Summary
| Measurement | Cajun | Immigrants from Syria |
| Minimum | $15,451 | $21,696 |
| Maximum | $57,514 | $88,902 |
| Range | $42,063 | $67,206 |
| Mean | $37,817 | $48,829 |
| Median | $38,499 | $48,019 |
| Interquartile 25% (IQ1) | $32,952 | $43,163 |
| Interquartile 75% (IQ3) | $42,585 | $52,131 |
| Interquartile Range (IQR) | $9,633 | $8,968 |
| Standard Deviation (Sample) | $7,734 | $12,024 |
| Standard Deviation (Population) | $7,686 | $11,923 |
Similar Demographics by Median Earnings
Demographics Similar to Cajuns by Median Earnings
In terms of median earnings, the demographic groups most similar to Cajuns are Colville ($42,151, a difference of 0.090%), Hmong ($42,111, a difference of 0.19%), Central American ($42,280, a difference of 0.21%), Spanish American ($42,316, a difference of 0.30%), and Immigrants from Belize ($42,339, a difference of 0.36%).
| Demographics | Rating | Rank | Median Earnings |
| Pennsylvania Germans | 0.5 /100 | #271 | Tragic $42,615 |
| Iroquois | 0.4 /100 | #272 | Tragic $42,430 |
| Immigrants | Dominica | 0.4 /100 | #273 | Tragic $42,420 |
| Immigrants | El Salvador | 0.4 /100 | #274 | Tragic $42,413 |
| Immigrants | Belize | 0.3 /100 | #275 | Tragic $42,339 |
| Spanish Americans | 0.3 /100 | #276 | Tragic $42,316 |
| Central Americans | 0.3 /100 | #277 | Tragic $42,280 |
| Cajuns | 0.3 /100 | #278 | Tragic $42,189 |
| Colville | 0.2 /100 | #279 | Tragic $42,151 |
| Hmong | 0.2 /100 | #280 | Tragic $42,111 |
| Marshallese | 0.2 /100 | #281 | Tragic $41,969 |
| Africans | 0.2 /100 | #282 | Tragic $41,955 |
| Dominicans | 0.2 /100 | #283 | Tragic $41,864 |
| Blackfeet | 0.2 /100 | #284 | Tragic $41,822 |
| Immigrants | Nicaragua | 0.1 /100 | #285 | Tragic $41,737 |
Demographics Similar to Immigrants from Syria by Median Earnings
In terms of median earnings, the demographic groups most similar to Immigrants from Syria are Brazilian ($48,356, a difference of 0.040%), Immigrants from Fiji ($48,305, a difference of 0.14%), Assyrian/Chaldean/Syriac ($48,304, a difference of 0.15%), Sierra Leonean ($48,286, a difference of 0.19%), and Immigrants from Philippines ($48,266, a difference of 0.23%).
| Demographics | Rating | Rank | Median Earnings |
| Koreans | 96.2 /100 | #116 | Exceptional $48,727 |
| Serbians | 95.9 /100 | #117 | Exceptional $48,677 |
| Immigrants | Jordan | 95.9 /100 | #118 | Exceptional $48,673 |
| Poles | 95.8 /100 | #119 | Exceptional $48,659 |
| Carpatho Rusyns | 95.5 /100 | #120 | Exceptional $48,617 |
| Arabs | 95.4 /100 | #121 | Exceptional $48,599 |
| Chileans | 94.8 /100 | #122 | Exceptional $48,504 |
| Immigrants | Syria | 93.9 /100 | #123 | Exceptional $48,375 |
| Brazilians | 93.7 /100 | #124 | Exceptional $48,356 |
| Immigrants | Fiji | 93.3 /100 | #125 | Exceptional $48,305 |
| Assyrians/Chaldeans/Syriacs | 93.3 /100 | #126 | Exceptional $48,304 |
| Sierra Leoneans | 93.1 /100 | #127 | Exceptional $48,286 |
| Immigrants | Philippines | 92.9 /100 | #128 | Exceptional $48,266 |
| Pakistanis | 92.8 /100 | #129 | Exceptional $48,254 |
| Zimbabweans | 92.6 /100 | #130 | Exceptional $48,229 |