Yuman vs Ute Median Family Income
COMPARE
Yuman
Ute
Median Family Income
Median Family Income Comparison
Yuman
Ute
$78,055
MEDIAN FAMILY INCOME
0.0/ 100
METRIC RATING
337th/ 347
METRIC RANK
$87,596
MEDIAN FAMILY INCOME
0.0/ 100
METRIC RATING
293rd/ 347
METRIC RANK
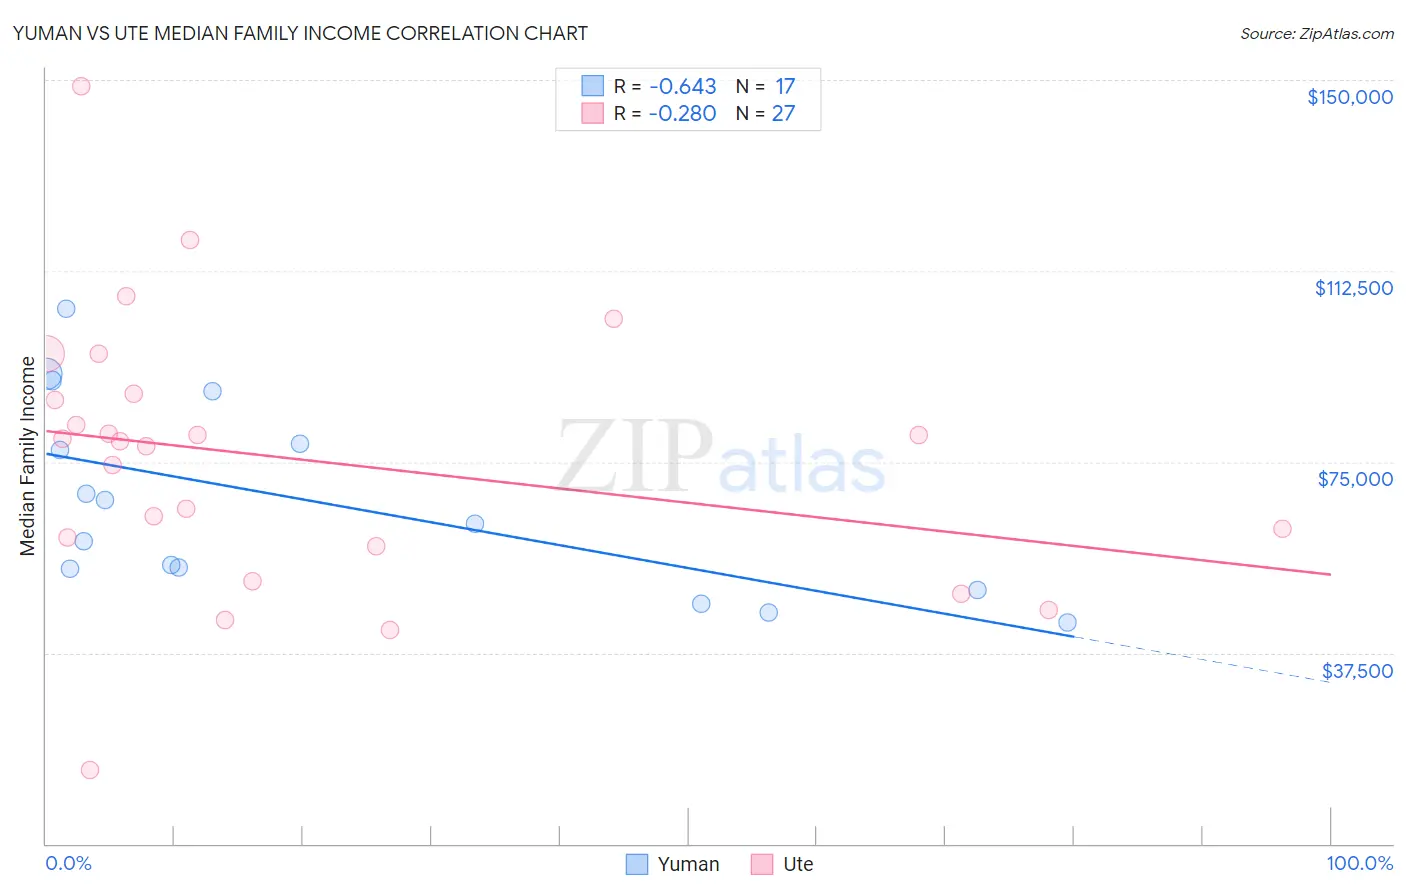
Yuman vs Ute Median Family Income Correlation Chart
The statistical analysis conducted on geographies consisting of 40,661,885 people shows a significant negative correlation between the proportion of Yuman and median family income in the United States with a correlation coefficient (R) of -0.643 and weighted average of $78,055. Similarly, the statistical analysis conducted on geographies consisting of 55,656,168 people shows a weak negative correlation between the proportion of Ute and median family income in the United States with a correlation coefficient (R) of -0.280 and weighted average of $87,596, a difference of 12.2%.
Median Family Income Correlation Summary
| Measurement | Yuman | Ute |
| Minimum | $43,500 | $14,519 |
| Maximum | $104,959 | $148,724 |
| Range | $61,459 | $134,205 |
| Mean | $67,052 | $75,455 |
| Median | $62,813 | $78,980 |
| Interquartile 25% (IQ1) | $51,959 | $58,333 |
| Interquartile 75% (IQ3) | $83,716 | $88,500 |
| Interquartile Range (IQR) | $31,757 | $30,167 |
| Standard Deviation (Sample) | $18,787 | $27,197 |
| Standard Deviation (Population) | $18,226 | $26,688 |
Similar Demographics by Median Family Income
Demographics Similar to Yuman by Median Family Income
In terms of median family income, the demographic groups most similar to Yuman are Immigrants from Cuba ($78,249, a difference of 0.25%), Immigrants from Yemen ($77,457, a difference of 0.77%), Pima ($77,431, a difference of 0.80%), Hopi ($77,188, a difference of 1.1%), and Pueblo ($76,880, a difference of 1.5%).
| Demographics | Rating | Rank | Median Family Income |
| Cheyenne | 0.0 /100 | #330 | Tragic $81,385 |
| Immigrants | Dominican Republic | 0.0 /100 | #331 | Tragic $81,233 |
| Natives/Alaskans | 0.0 /100 | #332 | Tragic $80,908 |
| Kiowa | 0.0 /100 | #333 | Tragic $80,885 |
| Menominee | 0.0 /100 | #334 | Tragic $79,563 |
| Yup'ik | 0.0 /100 | #335 | Tragic $79,290 |
| Immigrants | Cuba | 0.0 /100 | #336 | Tragic $78,249 |
| Yuman | 0.0 /100 | #337 | Tragic $78,055 |
| Immigrants | Yemen | 0.0 /100 | #338 | Tragic $77,457 |
| Pima | 0.0 /100 | #339 | Tragic $77,431 |
| Hopi | 0.0 /100 | #340 | Tragic $77,188 |
| Pueblo | 0.0 /100 | #341 | Tragic $76,880 |
| Crow | 0.0 /100 | #342 | Tragic $76,605 |
| Houma | 0.0 /100 | #343 | Tragic $76,188 |
| Tohono O'odham | 0.0 /100 | #344 | Tragic $72,193 |
Demographics Similar to Ute by Median Family Income
In terms of median family income, the demographic groups most similar to Ute are Fijian ($87,387, a difference of 0.24%), African ($87,820, a difference of 0.26%), Immigrants from Cabo Verde ($87,830, a difference of 0.27%), Shoshone ($87,872, a difference of 0.32%), and Yaqui ($87,289, a difference of 0.35%).
| Demographics | Rating | Rank | Median Family Income |
| Immigrants | Nicaragua | 0.1 /100 | #286 | Tragic $88,267 |
| Potawatomi | 0.1 /100 | #287 | Tragic $88,265 |
| Cherokee | 0.1 /100 | #288 | Tragic $88,209 |
| Central American Indians | 0.1 /100 | #289 | Tragic $88,034 |
| Shoshone | 0.1 /100 | #290 | Tragic $87,872 |
| Immigrants | Cabo Verde | 0.1 /100 | #291 | Tragic $87,830 |
| Africans | 0.1 /100 | #292 | Tragic $87,820 |
| Ute | 0.0 /100 | #293 | Tragic $87,596 |
| Fijians | 0.0 /100 | #294 | Tragic $87,387 |
| Yaqui | 0.0 /100 | #295 | Tragic $87,289 |
| Immigrants | Guatemala | 0.0 /100 | #296 | Tragic $87,191 |
| Cajuns | 0.0 /100 | #297 | Tragic $87,157 |
| Immigrants | Latin America | 0.0 /100 | #298 | Tragic $86,989 |
| Chippewa | 0.0 /100 | #299 | Tragic $86,852 |
| Ottawa | 0.0 /100 | #300 | Tragic $86,380 |