Haitian vs Ute Median Family Income
COMPARE
Haitian
Ute
Median Family Income
Median Family Income Comparison
Haitians
Ute
$85,218
MEDIAN FAMILY INCOME
0.0/ 100
METRIC RATING
309th/ 347
METRIC RANK
$87,596
MEDIAN FAMILY INCOME
0.0/ 100
METRIC RATING
293rd/ 347
METRIC RANK
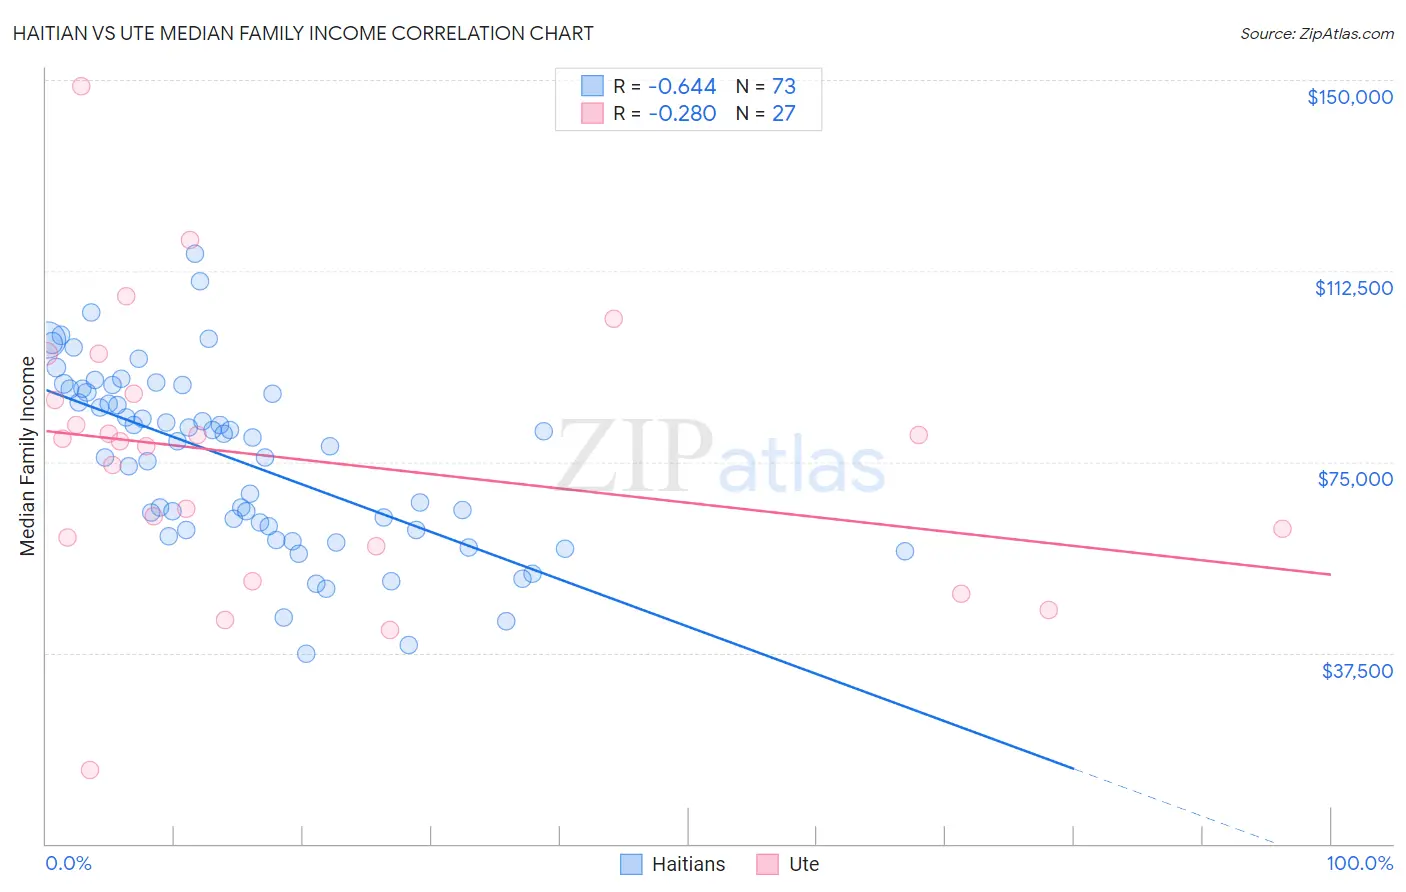
Haitian vs Ute Median Family Income Correlation Chart
The statistical analysis conducted on geographies consisting of 287,578,429 people shows a significant negative correlation between the proportion of Haitians and median family income in the United States with a correlation coefficient (R) of -0.644 and weighted average of $85,218. Similarly, the statistical analysis conducted on geographies consisting of 55,656,168 people shows a weak negative correlation between the proportion of Ute and median family income in the United States with a correlation coefficient (R) of -0.280 and weighted average of $87,596, a difference of 2.8%.
Median Family Income Correlation Summary
| Measurement | Haitian | Ute |
| Minimum | $37,244 | $14,519 |
| Maximum | $115,792 | $148,724 |
| Range | $78,548 | $134,205 |
| Mean | $75,276 | $75,455 |
| Median | $79,021 | $78,980 |
| Interquartile 25% (IQ1) | $61,587 | $58,333 |
| Interquartile 75% (IQ3) | $88,995 | $88,500 |
| Interquartile Range (IQR) | $27,408 | $30,167 |
| Standard Deviation (Sample) | $17,405 | $27,197 |
| Standard Deviation (Population) | $17,285 | $26,688 |
Demographics Similar to Haitians and Ute by Median Family Income
In terms of median family income, the demographic groups most similar to Haitians are U.S. Virgin Islander ($85,294, a difference of 0.090%), Chickasaw ($85,356, a difference of 0.16%), Immigrants from Central America ($85,050, a difference of 0.20%), Paiute ($85,414, a difference of 0.23%), and Immigrants from Dominica ($85,411, a difference of 0.23%). Similarly, the demographic groups most similar to Ute are Fijian ($87,387, a difference of 0.24%), African ($87,820, a difference of 0.26%), Immigrants from Cabo Verde ($87,830, a difference of 0.27%), Yaqui ($87,289, a difference of 0.35%), and Immigrants from Guatemala ($87,191, a difference of 0.46%).
| Demographics | Rating | Rank | Median Family Income |
| Immigrants | Cabo Verde | 0.1 /100 | #291 | Tragic $87,830 |
| Africans | 0.1 /100 | #292 | Tragic $87,820 |
| Ute | 0.0 /100 | #293 | Tragic $87,596 |
| Fijians | 0.0 /100 | #294 | Tragic $87,387 |
| Yaqui | 0.0 /100 | #295 | Tragic $87,289 |
| Immigrants | Guatemala | 0.0 /100 | #296 | Tragic $87,191 |
| Cajuns | 0.0 /100 | #297 | Tragic $87,157 |
| Immigrants | Latin America | 0.0 /100 | #298 | Tragic $86,989 |
| Chippewa | 0.0 /100 | #299 | Tragic $86,852 |
| Ottawa | 0.0 /100 | #300 | Tragic $86,380 |
| Colville | 0.0 /100 | #301 | Tragic $85,792 |
| Spanish American Indians | 0.0 /100 | #302 | Tragic $85,728 |
| Hispanics or Latinos | 0.0 /100 | #303 | Tragic $85,647 |
| Mexicans | 0.0 /100 | #304 | Tragic $85,618 |
| Paiute | 0.0 /100 | #305 | Tragic $85,414 |
| Immigrants | Dominica | 0.0 /100 | #306 | Tragic $85,411 |
| Chickasaw | 0.0 /100 | #307 | Tragic $85,356 |
| U.S. Virgin Islanders | 0.0 /100 | #308 | Tragic $85,294 |
| Haitians | 0.0 /100 | #309 | Tragic $85,218 |
| Immigrants | Central America | 0.0 /100 | #310 | Tragic $85,050 |
| Hondurans | 0.0 /100 | #311 | Tragic $85,004 |