Scottish vs Ugandan Median Earnings
COMPARE
Scottish
Ugandan
Median Earnings
Median Earnings Comparison
Scottish
Ugandans
$46,463
MEDIAN EARNINGS
51.1/ 100
METRIC RATING
171st/ 347
METRIC RANK
$47,854
MEDIAN EARNINGS
88.0/ 100
METRIC RATING
142nd/ 347
METRIC RANK
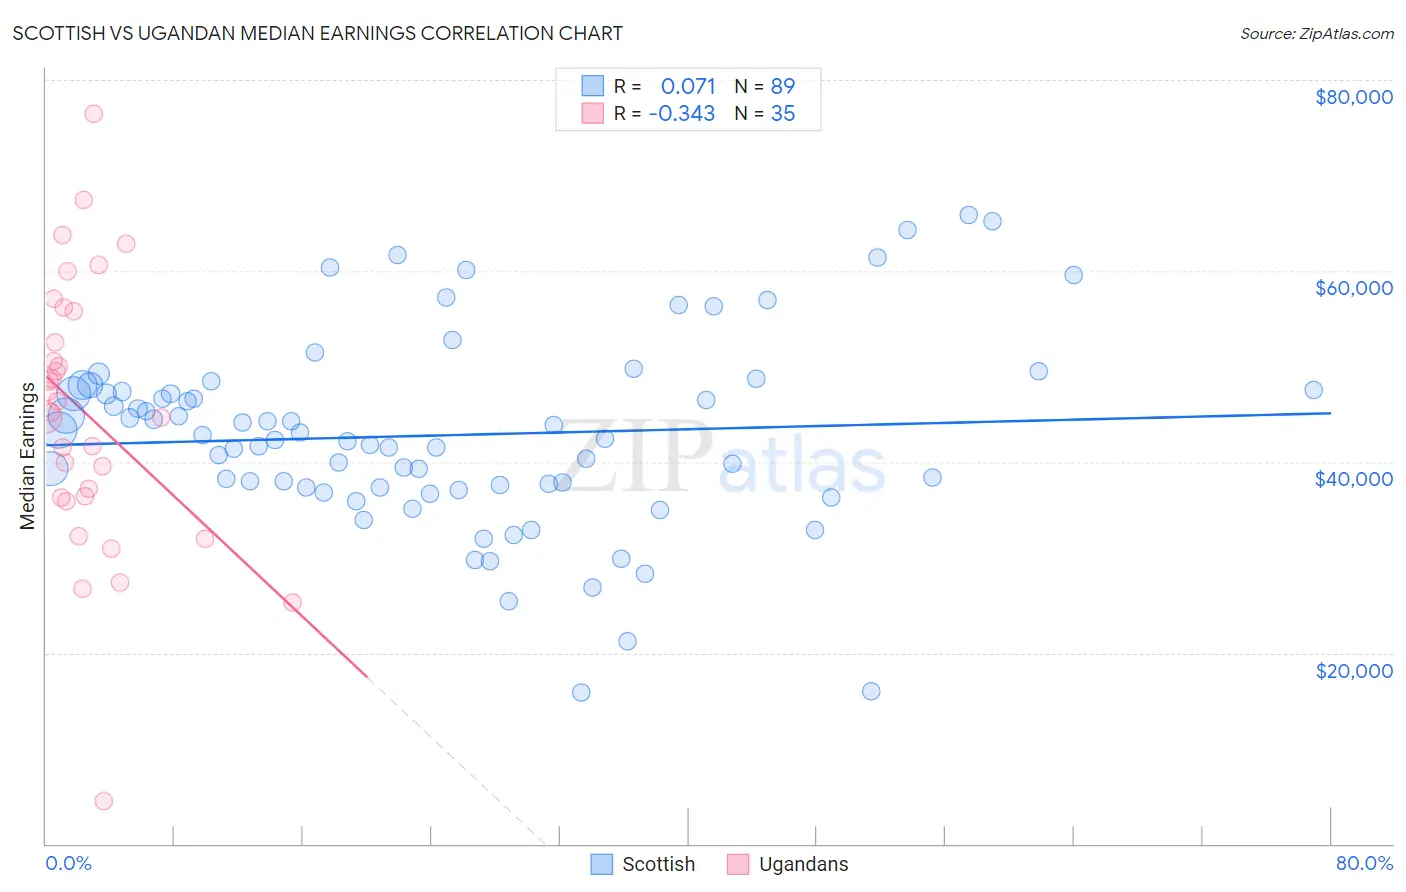
Scottish vs Ugandan Median Earnings Correlation Chart
The statistical analysis conducted on geographies consisting of 566,727,136 people shows a slight positive correlation between the proportion of Scottish and median earnings in the United States with a correlation coefficient (R) of 0.071 and weighted average of $46,463. Similarly, the statistical analysis conducted on geographies consisting of 94,012,409 people shows a mild negative correlation between the proportion of Ugandans and median earnings in the United States with a correlation coefficient (R) of -0.343 and weighted average of $47,854, a difference of 3.0%.
Median Earnings Correlation Summary
| Measurement | Scottish | Ugandan |
| Minimum | $15,833 | $4,426 |
| Maximum | $65,898 | $76,513 |
| Range | $50,065 | $72,087 |
| Mean | $42,786 | $45,002 |
| Median | $42,413 | $45,167 |
| Interquartile 25% (IQ1) | $37,295 | $36,215 |
| Interquartile 75% (IQ3) | $47,447 | $55,750 |
| Interquartile Range (IQR) | $10,152 | $19,535 |
| Standard Deviation (Sample) | $10,003 | $14,118 |
| Standard Deviation (Population) | $9,946 | $13,915 |
Similar Demographics by Median Earnings
Demographics Similar to Scottish by Median Earnings
In terms of median earnings, the demographic groups most similar to Scottish are Kenyan ($46,462, a difference of 0.0%), Immigrants ($46,478, a difference of 0.030%), Ghanaian ($46,440, a difference of 0.050%), Scandinavian ($46,433, a difference of 0.060%), and Basque ($46,399, a difference of 0.14%).
| Demographics | Rating | Rank | Median Earnings |
| Norwegians | 64.7 /100 | #164 | Good $46,865 |
| South Americans | 62.7 /100 | #165 | Good $46,804 |
| Czechoslovakians | 57.8 /100 | #166 | Average $46,658 |
| Costa Ricans | 57.4 /100 | #167 | Average $46,645 |
| Immigrants | Africa | 54.6 /100 | #168 | Average $46,564 |
| Immigrants | South America | 54.0 /100 | #169 | Average $46,548 |
| Immigrants | Immigrants | 51.6 /100 | #170 | Average $46,478 |
| Scottish | 51.1 /100 | #171 | Average $46,463 |
| Kenyans | 51.0 /100 | #172 | Average $46,462 |
| Ghanaians | 50.3 /100 | #173 | Average $46,440 |
| Scandinavians | 50.0 /100 | #174 | Average $46,433 |
| Basques | 48.8 /100 | #175 | Average $46,399 |
| Danes | 48.6 /100 | #176 | Average $46,392 |
| Belgians | 48.0 /100 | #177 | Average $46,375 |
| Colombians | 47.1 /100 | #178 | Average $46,349 |
Demographics Similar to Ugandans by Median Earnings
In terms of median earnings, the demographic groups most similar to Ugandans are Swedish ($47,851, a difference of 0.010%), Immigrants from Sierra Leone ($47,875, a difference of 0.040%), Taiwanese ($47,902, a difference of 0.10%), Canadian ($47,911, a difference of 0.12%), and Hungarian ($47,795, a difference of 0.12%).
| Demographics | Rating | Rank | Median Earnings |
| Portuguese | 90.4 /100 | #135 | Exceptional $48,032 |
| Slovenes | 90.0 /100 | #136 | Excellent $47,995 |
| Immigrants | Nepal | 89.0 /100 | #137 | Excellent $47,925 |
| Europeans | 88.9 /100 | #138 | Excellent $47,915 |
| Canadians | 88.8 /100 | #139 | Excellent $47,911 |
| Taiwanese | 88.7 /100 | #140 | Excellent $47,902 |
| Immigrants | Sierra Leone | 88.3 /100 | #141 | Excellent $47,875 |
| Ugandans | 88.0 /100 | #142 | Excellent $47,854 |
| Swedes | 88.0 /100 | #143 | Excellent $47,851 |
| Hungarians | 87.1 /100 | #144 | Excellent $47,795 |
| Immigrants | Saudi Arabia | 85.6 /100 | #145 | Excellent $47,704 |
| Immigrants | Chile | 85.5 /100 | #146 | Excellent $47,697 |
| Immigrants | South Eastern Asia | 85.0 /100 | #147 | Excellent $47,671 |
| Immigrants | Eritrea | 84.8 /100 | #148 | Excellent $47,657 |
| Luxembourgers | 84.5 /100 | #149 | Excellent $47,640 |