Scottish vs Alaskan Athabascan Median Earnings
COMPARE
Scottish
Alaskan Athabascan
Median Earnings
Median Earnings Comparison
Scottish
Alaskan Athabascans
$46,463
MEDIAN EARNINGS
51.1/ 100
METRIC RATING
171st/ 347
METRIC RANK
$43,393
MEDIAN EARNINGS
1.4/ 100
METRIC RATING
256th/ 347
METRIC RANK
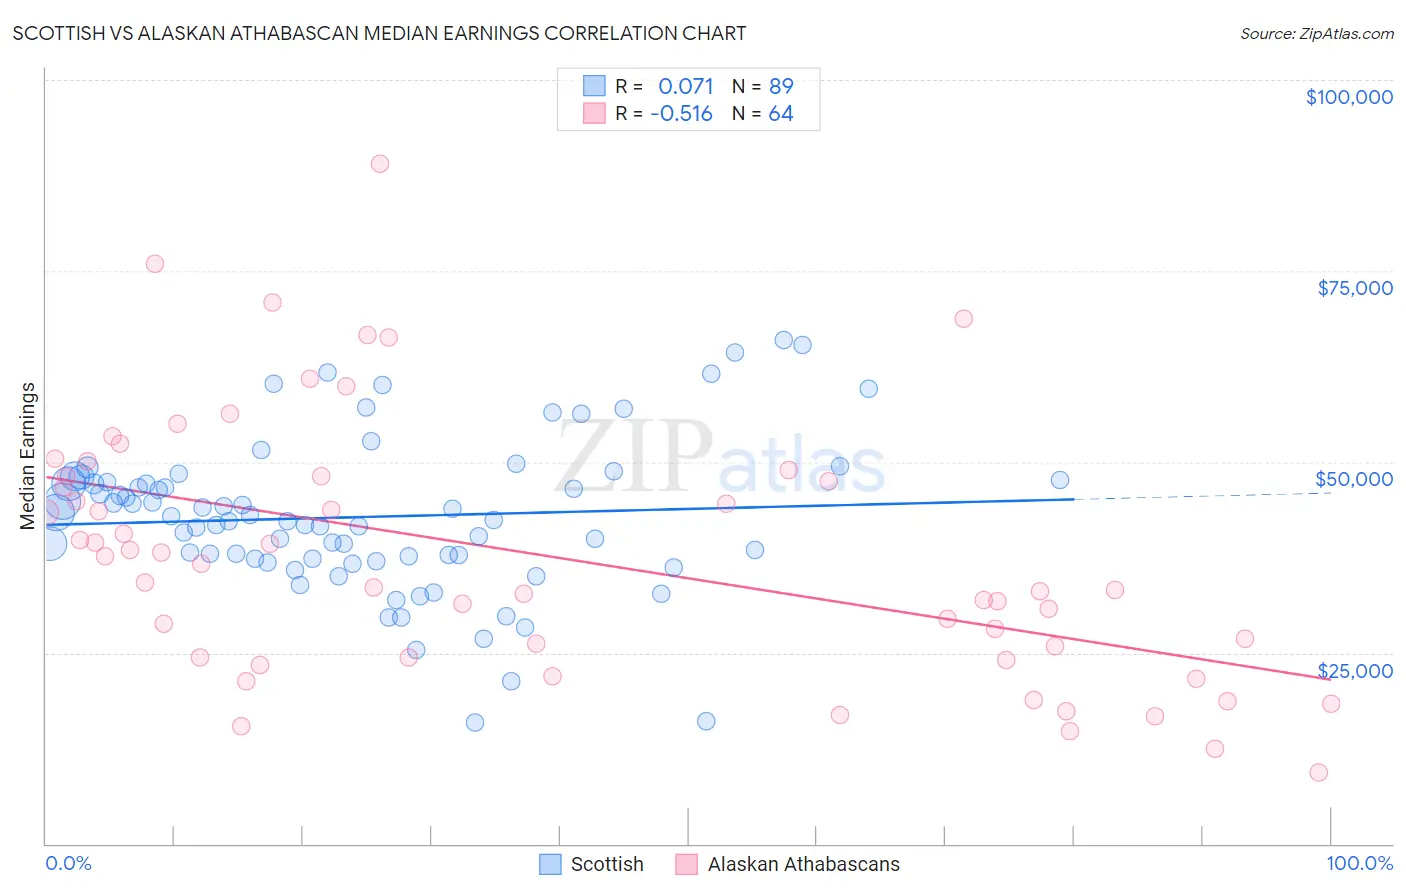
Scottish vs Alaskan Athabascan Median Earnings Correlation Chart
The statistical analysis conducted on geographies consisting of 566,727,136 people shows a slight positive correlation between the proportion of Scottish and median earnings in the United States with a correlation coefficient (R) of 0.071 and weighted average of $46,463. Similarly, the statistical analysis conducted on geographies consisting of 45,815,417 people shows a substantial negative correlation between the proportion of Alaskan Athabascans and median earnings in the United States with a correlation coefficient (R) of -0.516 and weighted average of $43,393, a difference of 7.1%.
Median Earnings Correlation Summary
| Measurement | Scottish | Alaskan Athabascan |
| Minimum | $15,833 | $9,375 |
| Maximum | $65,898 | $89,063 |
| Range | $50,065 | $79,688 |
| Mean | $42,786 | $37,849 |
| Median | $42,413 | $35,412 |
| Interquartile 25% (IQ1) | $37,295 | $24,340 |
| Interquartile 75% (IQ3) | $47,447 | $48,159 |
| Interquartile Range (IQR) | $10,152 | $23,819 |
| Standard Deviation (Sample) | $10,003 | $17,033 |
| Standard Deviation (Population) | $9,946 | $16,899 |
Similar Demographics by Median Earnings
Demographics Similar to Scottish by Median Earnings
In terms of median earnings, the demographic groups most similar to Scottish are Kenyan ($46,462, a difference of 0.0%), Immigrants ($46,478, a difference of 0.030%), Ghanaian ($46,440, a difference of 0.050%), Scandinavian ($46,433, a difference of 0.060%), and Basque ($46,399, a difference of 0.14%).
| Demographics | Rating | Rank | Median Earnings |
| Norwegians | 64.7 /100 | #164 | Good $46,865 |
| South Americans | 62.7 /100 | #165 | Good $46,804 |
| Czechoslovakians | 57.8 /100 | #166 | Average $46,658 |
| Costa Ricans | 57.4 /100 | #167 | Average $46,645 |
| Immigrants | Africa | 54.6 /100 | #168 | Average $46,564 |
| Immigrants | South America | 54.0 /100 | #169 | Average $46,548 |
| Immigrants | Immigrants | 51.6 /100 | #170 | Average $46,478 |
| Scottish | 51.1 /100 | #171 | Average $46,463 |
| Kenyans | 51.0 /100 | #172 | Average $46,462 |
| Ghanaians | 50.3 /100 | #173 | Average $46,440 |
| Scandinavians | 50.0 /100 | #174 | Average $46,433 |
| Basques | 48.8 /100 | #175 | Average $46,399 |
| Danes | 48.6 /100 | #176 | Average $46,392 |
| Belgians | 48.0 /100 | #177 | Average $46,375 |
| Colombians | 47.1 /100 | #178 | Average $46,349 |
Demographics Similar to Alaskan Athabascans by Median Earnings
In terms of median earnings, the demographic groups most similar to Alaskan Athabascans are Immigrants from Middle Africa ($43,416, a difference of 0.050%), Jamaican ($43,343, a difference of 0.12%), French American Indian ($43,333, a difference of 0.14%), Liberian ($43,536, a difference of 0.33%), and Somali ($43,567, a difference of 0.40%).
| Demographics | Rating | Rank | Median Earnings |
| Malaysians | 2.6 /100 | #249 | Tragic $43,844 |
| Alaska Natives | 2.3 /100 | #250 | Tragic $43,750 |
| Tsimshian | 2.1 /100 | #251 | Tragic $43,695 |
| Hawaiians | 2.0 /100 | #252 | Tragic $43,673 |
| Somalis | 1.8 /100 | #253 | Tragic $43,567 |
| Liberians | 1.7 /100 | #254 | Tragic $43,536 |
| Immigrants | Middle Africa | 1.4 /100 | #255 | Tragic $43,416 |
| Alaskan Athabascans | 1.4 /100 | #256 | Tragic $43,393 |
| Jamaicans | 1.3 /100 | #257 | Tragic $43,343 |
| French American Indians | 1.3 /100 | #258 | Tragic $43,333 |
| German Russians | 1.1 /100 | #259 | Tragic $43,200 |
| Immigrants | Somalia | 0.9 /100 | #260 | Tragic $43,100 |
| Immigrants | Jamaica | 0.8 /100 | #261 | Tragic $43,026 |
| Nicaraguans | 0.8 /100 | #262 | Tragic $43,026 |
| Inupiat | 0.8 /100 | #263 | Tragic $43,000 |