Scottish vs Immigrants from Panama Householder Income Ages 25 - 44 years
COMPARE
Scottish
Immigrants from Panama
Householder Income Ages 25 - 44 years
Householder Income Ages 25 - 44 years Comparison
Scottish
Immigrants from Panama
$94,622
HOUSEHOLDER INCOME AGES 25 - 44 YEARS
50.8/ 100
METRIC RATING
172nd/ 347
METRIC RANK
$89,451
HOUSEHOLDER INCOME AGES 25 - 44 YEARS
5.5/ 100
METRIC RATING
225th/ 347
METRIC RANK
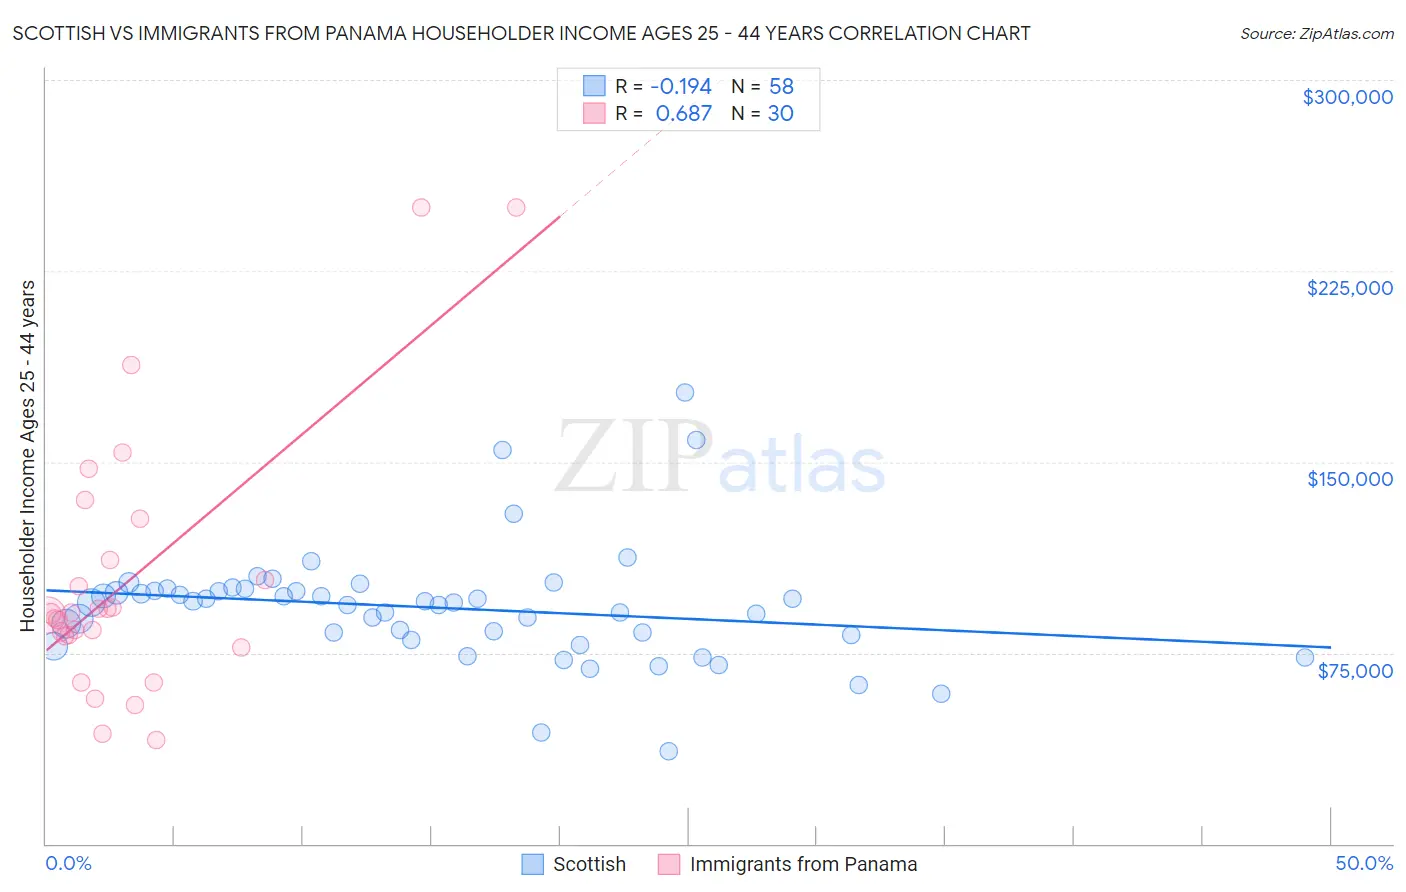
Scottish vs Immigrants from Panama Householder Income Ages 25 - 44 years Correlation Chart
The statistical analysis conducted on geographies consisting of 561,360,199 people shows a poor negative correlation between the proportion of Scottish and household income with householder between the ages 25 and 44 in the United States with a correlation coefficient (R) of -0.194 and weighted average of $94,622. Similarly, the statistical analysis conducted on geographies consisting of 221,047,816 people shows a significant positive correlation between the proportion of Immigrants from Panama and household income with householder between the ages 25 and 44 in the United States with a correlation coefficient (R) of 0.687 and weighted average of $89,451, a difference of 5.8%.
Householder Income Ages 25 - 44 years Correlation Summary
| Measurement | Scottish | Immigrants from Panama |
| Minimum | $36,186 | $40,673 |
| Maximum | $177,052 | $250,001 |
| Range | $140,866 | $209,328 |
| Mean | $92,714 | $103,544 |
| Median | $94,762 | $90,149 |
| Interquartile 25% (IQ1) | $81,966 | $81,630 |
| Interquartile 75% (IQ3) | $99,308 | $111,639 |
| Interquartile Range (IQR) | $17,342 | $30,009 |
| Standard Deviation (Sample) | $23,114 | $51,093 |
| Standard Deviation (Population) | $22,914 | $50,234 |
Similar Demographics by Householder Income Ages 25 - 44 years
Demographics Similar to Scottish by Householder Income Ages 25 - 44 years
In terms of householder income ages 25 - 44 years, the demographic groups most similar to Scottish are Finnish ($94,610, a difference of 0.010%), Colombian ($94,565, a difference of 0.060%), English ($94,429, a difference of 0.21%), Immigrants ($94,423, a difference of 0.21%), and Immigrants from Armenia ($94,867, a difference of 0.26%).
| Demographics | Rating | Rank | Householder Income Ages 25 - 44 years |
| Immigrants | Nepal | 60.3 /100 | #165 | Good $95,322 |
| Immigrants | Ethiopia | 59.5 /100 | #166 | Average $95,256 |
| Czechoslovakians | 57.0 /100 | #167 | Average $95,070 |
| Alsatians | 56.8 /100 | #168 | Average $95,059 |
| Native Hawaiians | 56.8 /100 | #169 | Average $95,058 |
| Slovaks | 56.4 /100 | #170 | Average $95,032 |
| Immigrants | Armenia | 54.2 /100 | #171 | Average $94,867 |
| Scottish | 50.8 /100 | #172 | Average $94,622 |
| Finns | 50.6 /100 | #173 | Average $94,610 |
| Colombians | 50.0 /100 | #174 | Average $94,565 |
| English | 48.1 /100 | #175 | Average $94,429 |
| Immigrants | Immigrants | 48.0 /100 | #176 | Average $94,423 |
| Belgians | 45.8 /100 | #177 | Average $94,262 |
| Immigrants | South America | 42.8 /100 | #178 | Average $94,042 |
| French Canadians | 38.2 /100 | #179 | Fair $93,694 |
Demographics Similar to Immigrants from Panama by Householder Income Ages 25 - 44 years
In terms of householder income ages 25 - 44 years, the demographic groups most similar to Immigrants from Panama are Immigrants from Iraq ($89,444, a difference of 0.010%), Barbadian ($89,565, a difference of 0.13%), Immigrants from Guyana ($89,586, a difference of 0.15%), Immigrants from Ecuador ($89,673, a difference of 0.25%), and Immigrants from Trinidad and Tobago ($89,748, a difference of 0.33%).
| Demographics | Rating | Rank | Householder Income Ages 25 - 44 years |
| Guyanese | 7.1 /100 | #218 | Tragic $89,940 |
| Delaware | 6.9 /100 | #219 | Tragic $89,876 |
| Trinidadians and Tobagonians | 6.8 /100 | #220 | Tragic $89,856 |
| Immigrants | Trinidad and Tobago | 6.5 /100 | #221 | Tragic $89,748 |
| Immigrants | Ecuador | 6.2 /100 | #222 | Tragic $89,673 |
| Immigrants | Guyana | 5.9 /100 | #223 | Tragic $89,586 |
| Barbadians | 5.9 /100 | #224 | Tragic $89,565 |
| Immigrants | Panama | 5.5 /100 | #225 | Tragic $89,451 |
| Immigrants | Iraq | 5.5 /100 | #226 | Tragic $89,444 |
| Immigrants | St. Vincent and the Grenadines | 4.1 /100 | #227 | Tragic $88,888 |
| Immigrants | Bosnia and Herzegovina | 4.0 /100 | #228 | Tragic $88,819 |
| Immigrants | Barbados | 3.7 /100 | #229 | Tragic $88,687 |
| Alaskan Athabascans | 3.3 /100 | #230 | Tragic $88,446 |
| Immigrants | Grenada | 3.0 /100 | #231 | Tragic $88,311 |
| Immigrants | Nonimmigrants | 3.0 /100 | #232 | Tragic $88,301 |