Immigrants from Taiwan vs Immigrants from Panama Householder Income Ages 25 - 44 years
COMPARE
Immigrants from Taiwan
Immigrants from Panama
Householder Income Ages 25 - 44 years
Householder Income Ages 25 - 44 years Comparison
Immigrants from Taiwan
Immigrants from Panama
$129,122
HOUSEHOLDER INCOME AGES 25 - 44 YEARS
100.0/ 100
METRIC RATING
1st/ 347
METRIC RANK
$89,451
HOUSEHOLDER INCOME AGES 25 - 44 YEARS
5.5/ 100
METRIC RATING
225th/ 347
METRIC RANK
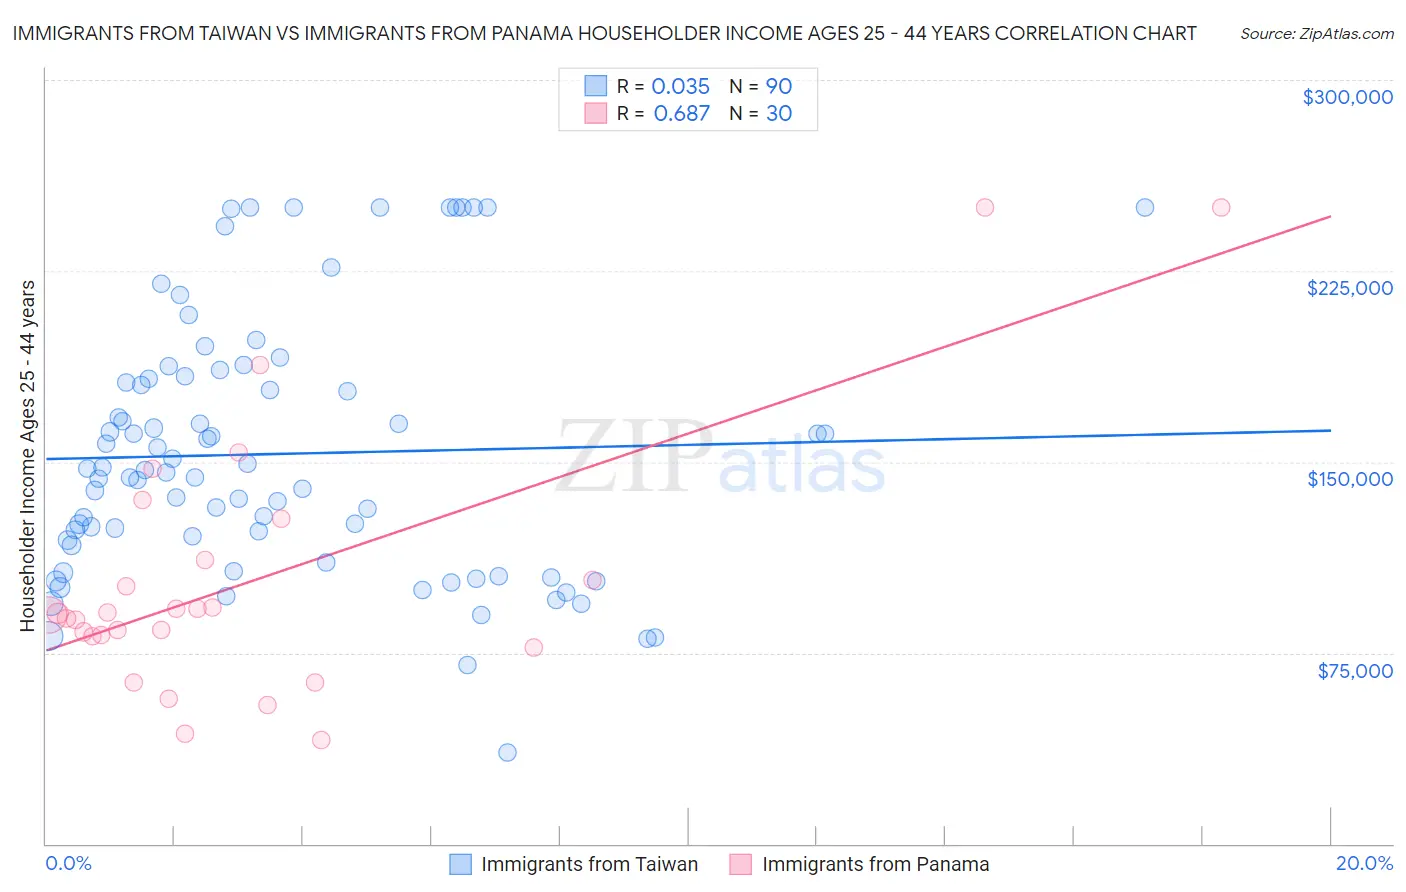
Immigrants from Taiwan vs Immigrants from Panama Householder Income Ages 25 - 44 years Correlation Chart
The statistical analysis conducted on geographies consisting of 297,780,144 people shows no correlation between the proportion of Immigrants from Taiwan and household income with householder between the ages 25 and 44 in the United States with a correlation coefficient (R) of 0.035 and weighted average of $129,122. Similarly, the statistical analysis conducted on geographies consisting of 221,047,816 people shows a significant positive correlation between the proportion of Immigrants from Panama and household income with householder between the ages 25 and 44 in the United States with a correlation coefficient (R) of 0.687 and weighted average of $89,451, a difference of 44.4%.
Householder Income Ages 25 - 44 years Correlation Summary
| Measurement | Immigrants from Taiwan | Immigrants from Panama |
| Minimum | $35,653 | $40,673 |
| Maximum | $250,001 | $250,001 |
| Range | $214,348 | $209,328 |
| Mean | $153,134 | $103,544 |
| Median | $146,407 | $90,149 |
| Interquartile 25% (IQ1) | $117,158 | $81,630 |
| Interquartile 75% (IQ3) | $182,503 | $111,639 |
| Interquartile Range (IQR) | $65,344 | $30,009 |
| Standard Deviation (Sample) | $50,634 | $51,093 |
| Standard Deviation (Population) | $50,352 | $50,234 |
Similar Demographics by Householder Income Ages 25 - 44 years
Demographics Similar to Immigrants from Taiwan by Householder Income Ages 25 - 44 years
In terms of householder income ages 25 - 44 years, the demographic groups most similar to Immigrants from Taiwan are Filipino ($128,723, a difference of 0.31%), Immigrants from Hong Kong ($128,140, a difference of 0.77%), Immigrants from Singapore ($124,429, a difference of 3.8%), Immigrants from India ($124,238, a difference of 3.9%), and Thai ($121,778, a difference of 6.0%).
| Demographics | Rating | Rank | Householder Income Ages 25 - 44 years |
| Immigrants | Taiwan | 100.0 /100 | #1 | Exceptional $129,122 |
| Filipinos | 100.0 /100 | #2 | Exceptional $128,723 |
| Immigrants | Hong Kong | 100.0 /100 | #3 | Exceptional $128,140 |
| Immigrants | Singapore | 100.0 /100 | #4 | Exceptional $124,429 |
| Immigrants | India | 100.0 /100 | #5 | Exceptional $124,238 |
| Thais | 100.0 /100 | #6 | Exceptional $121,778 |
| Immigrants | Ireland | 100.0 /100 | #7 | Exceptional $120,333 |
| Iranians | 100.0 /100 | #8 | Exceptional $120,292 |
| Immigrants | China | 100.0 /100 | #9 | Exceptional $119,756 |
| Indians (Asian) | 100.0 /100 | #10 | Exceptional $119,496 |
| Okinawans | 100.0 /100 | #11 | Exceptional $119,349 |
| Immigrants | Iran | 100.0 /100 | #12 | Exceptional $119,204 |
| Immigrants | Eastern Asia | 100.0 /100 | #13 | Exceptional $118,056 |
| Immigrants | Israel | 100.0 /100 | #14 | Exceptional $117,219 |
| Immigrants | South Central Asia | 100.0 /100 | #15 | Exceptional $116,626 |
Demographics Similar to Immigrants from Panama by Householder Income Ages 25 - 44 years
In terms of householder income ages 25 - 44 years, the demographic groups most similar to Immigrants from Panama are Immigrants from Iraq ($89,444, a difference of 0.010%), Barbadian ($89,565, a difference of 0.13%), Immigrants from Guyana ($89,586, a difference of 0.15%), Immigrants from Ecuador ($89,673, a difference of 0.25%), and Immigrants from Trinidad and Tobago ($89,748, a difference of 0.33%).
| Demographics | Rating | Rank | Householder Income Ages 25 - 44 years |
| Guyanese | 7.1 /100 | #218 | Tragic $89,940 |
| Delaware | 6.9 /100 | #219 | Tragic $89,876 |
| Trinidadians and Tobagonians | 6.8 /100 | #220 | Tragic $89,856 |
| Immigrants | Trinidad and Tobago | 6.5 /100 | #221 | Tragic $89,748 |
| Immigrants | Ecuador | 6.2 /100 | #222 | Tragic $89,673 |
| Immigrants | Guyana | 5.9 /100 | #223 | Tragic $89,586 |
| Barbadians | 5.9 /100 | #224 | Tragic $89,565 |
| Immigrants | Panama | 5.5 /100 | #225 | Tragic $89,451 |
| Immigrants | Iraq | 5.5 /100 | #226 | Tragic $89,444 |
| Immigrants | St. Vincent and the Grenadines | 4.1 /100 | #227 | Tragic $88,888 |
| Immigrants | Bosnia and Herzegovina | 4.0 /100 | #228 | Tragic $88,819 |
| Immigrants | Barbados | 3.7 /100 | #229 | Tragic $88,687 |
| Alaskan Athabascans | 3.3 /100 | #230 | Tragic $88,446 |
| Immigrants | Grenada | 3.0 /100 | #231 | Tragic $88,311 |
| Immigrants | Nonimmigrants | 3.0 /100 | #232 | Tragic $88,301 |