Scottish vs Immigrants from Panama Unemployment Among Ages 55 to 59 years

COMPARE

Scottish
Race
Ancestry
AfghanAfricanAlaska NativeAlaskan AthabascanAlbanianAleutAlsatianAmericanApacheArabArapahoArgentineanArmenianAssyrian/Chaldean/SyriacAustralianAustrianBahamianBangladeshiBarbadianBasqueBelgianBelizeanBermudanBhutaneseBlackfeetBolivianBrazilianBritishBritish West IndianBulgarianBurmeseCajunCambodianCanadianCape VerdeanCarpatho RusynCelticCentral AmericanCentral American IndianCherokeeCheyenneChickasawChileanChineseChippewaChoctawColombianColvilleComancheCosta RicanCreeCreekCroatianCrowCubanCypriotCzechCzechoslovakianDanishDelawareDominicanDutchDutch West IndianEastern EuropeanEcuadorianEgyptianEnglishEstonianEthiopianEuropeanFijianFilipinoFinnishFrenchFrench American IndianFrench CanadianGermanGerman RussianGhanaianGreekGuamanian/ChamorroGuatemalanGuyaneseHaitianHmongHonduranHopiHoumaHungarianIcelanderIndian (Asian)IndonesianInupiatIranianIraqiIrishIroquoisIsraeliItalianJamaicanJapaneseJordanianKenyanKiowaKoreanLaotianLatvianLebaneseLiberianLithuanianLumbeeLuxembourgerMacedonianMalaysianMalteseMarshalleseMenomineeMexicanMexican American IndianMongolianMoroccanNative HawaiianNavajoNepaleseNew ZealanderNicaraguanNigerianNorthern EuropeanNorwegianOkinawanOsageOttawaPaiutePakistaniPalestinianPanamanianParaguayanPennsylvania GermanPeruvianPimaPolishPortuguesePotawatomiPuebloPuerto RicanPuget Sound SalishRomanianRussianSalvadoranSamoanScandinavianScotch-IrishScottishSeminoleSenegaleseSerbianShoshoneSierra LeoneanSiouxSlavicSlovakSloveneSomaliSouth AfricanSouth AmericanSouth American IndianSoviet UnionSpaniardSpanishSpanish AmericanSpanish American IndianSri LankanSubsaharan AfricanSudaneseSwedishSwissSyrianTaiwaneseThaiTlingit-HaidaTohono O'OdhamTonganTrinidadian and TobagonianTsimshianTurkishU.S. Virgin IslanderUgandanUkrainianUruguayanUteVenezuelanVietnameseWelshWest IndianYakamaYaquiYugoslavianYumanYup'ikZimbabwean
Immigration
NonimmigrantsImmigrantsAfghanistanAfricaAlbaniaArgentinaArmeniaAsiaAustraliaAustriaBahamasBangladeshBarbadosBelarusBelgiumBelizeBoliviaBosnia and HerzegovinaBrazilBulgariaBurma/MyanmarCabo VerdeCambodiaCameroonCanadaCaribbeanCentral AmericaChileChinaColombiaCongoCosta RicaCroatiaCubaCzechoslovakiaDenmarkDominicaDominican RepublicEastern AfricaEastern AsiaEastern EuropeEcuadorEgyptEl SalvadorEnglandEritreaEthiopiaEuropeFijiFranceGermanyGhanaGreeceGrenadaGuatemalaGuyanaHaitiHondurasHong KongHungaryIndiaIndonesiaIranIraqIrelandIsraelItalyJamaicaJapanJordanKazakhstanKenyaKoreaKuwaitLaosLatin AmericaLatviaLebanonLiberiaLithuaniaMalaysiaMexicoMicronesiaMiddle AfricaMoldovaMoroccoNepalNetherlandsNicaraguaNigeriaNorth AmericaNorth MacedoniaNorthern AfricaNorthern EuropeNorwayOceaniaPakistanPeruPhilippinesPolandPortugalRomaniaRussiaSaudi ArabiaScotlandSenegalSerbiaSierra LeoneSingaporeSomaliaSouth AfricaSouth AmericaSouth Central AsiaSouth Eastern AsiaSouthern EuropeSpainSri LankaSt. Vincent and the GrenadinesSudanSwedenSwitzerlandSyriaTaiwanThailandTrinidad and TobagoTurkeyUgandaUkraineUruguayUzbekistanVenezuelaVietnamWest IndiesWestern AfricaWestern AsiaWestern EuropeYemenZaireZimbabweAzores
Immigrants from Panama
Race
Ancestry
AfghanAfricanAlaska NativeAlaskan AthabascanAlbanianAleutAlsatianAmericanApacheArabArapahoArgentineanArmenianAssyrian/Chaldean/SyriacAustralianAustrianBahamianBangladeshiBarbadianBasqueBelgianBelizeanBermudanBhutaneseBlackfeetBolivianBrazilianBritishBritish West IndianBulgarianBurmeseCajunCambodianCanadianCape VerdeanCarpatho RusynCelticCentral AmericanCentral American IndianCherokeeCheyenneChickasawChileanChineseChippewaChoctawColombianColvilleComancheCosta RicanCreeCreekCroatianCrowCubanCypriotCzechCzechoslovakianDanishDelawareDominicanDutchDutch West IndianEastern EuropeanEcuadorianEgyptianEnglishEstonianEthiopianEuropeanFijianFilipinoFinnishFrenchFrench American IndianFrench CanadianGermanGerman RussianGhanaianGreekGuamanian/ChamorroGuatemalanGuyaneseHaitianHmongHonduranHopiHoumaHungarianIcelanderIndian (Asian)IndonesianInupiatIranianIraqiIrishIroquoisIsraeliItalianJamaicanJapaneseJordanianKenyanKiowaKoreanLaotianLatvianLebaneseLiberianLithuanianLumbeeLuxembourgerMacedonianMalaysianMalteseMarshalleseMenomineeMexicanMexican American IndianMongolianMoroccanNative HawaiianNavajoNepaleseNew ZealanderNicaraguanNigerianNorthern EuropeanNorwegianOkinawanOsageOttawaPaiutePakistaniPalestinianPanamanianParaguayanPennsylvania GermanPeruvianPimaPolishPortuguesePotawatomiPuebloPuerto RicanPuget Sound SalishRomanianRussianSalvadoranSamoanScandinavianScotch-IrishSeminoleSenegaleseSerbianShoshoneSierra LeoneanSiouxSlavicSlovakSloveneSomaliSouth AfricanSouth AmericanSouth American IndianSoviet UnionSpaniardSpanishSpanish AmericanSpanish American IndianSri LankanSubsaharan AfricanSudaneseSwedishSwissSyrianTaiwaneseThaiTlingit-HaidaTohono O'OdhamTonganTrinidadian and TobagonianTsimshianTurkishU.S. Virgin IslanderUgandanUkrainianUruguayanUteVenezuelanVietnameseWelshWest IndianYakamaYaquiYugoslavianYumanYup'ikZimbabwean
Immigration
NonimmigrantsImmigrantsAfghanistanAfricaAlbaniaArgentinaArmeniaAsiaAustraliaAustriaBahamasBangladeshBarbadosBelarusBelgiumBelizeBoliviaBosnia and HerzegovinaBrazilBulgariaBurma/MyanmarCabo VerdeCambodiaCameroonCanadaCaribbeanCentral AmericaChileChinaColombiaCongoCosta RicaCroatiaCubaCzechoslovakiaDenmarkDominicaDominican RepublicEastern AfricaEastern AsiaEastern EuropeEcuadorEgyptEl SalvadorEnglandEritreaEthiopiaEuropeFijiFranceGermanyGhanaGreeceGrenadaGuatemalaGuyanaHaitiHondurasHong KongHungaryIndiaIndonesiaIranIraqIrelandIsraelItalyJamaicaJapanJordanKazakhstanKenyaKoreaKuwaitLaosLatin AmericaLatviaLebanonLiberiaLithuaniaMalaysiaMexicoMicronesiaMiddle AfricaMoldovaMoroccoNepalNetherlandsNicaraguaNigeriaNorth AmericaNorth MacedoniaNorthern AfricaNorthern EuropeNorwayOceaniaPakistanPanamaPeruPhilippinesPolandPortugalRomaniaRussiaSaudi ArabiaScotlandSenegalSerbiaSierra LeoneSingaporeSomaliaSouth AfricaSouth AmericaSouth Central AsiaSouth Eastern AsiaSouthern EuropeSpainSri LankaSt. Vincent and the GrenadinesSudanSwedenSwitzerlandSyriaTaiwanThailandTrinidad and TobagoTurkeyUgandaUkraineUruguayUzbekistanVenezuelaVietnamWest IndiesWestern AfricaWestern AsiaWestern EuropeYemenZaireZimbabweAzores
Unemployment Among Ages 55 to 59 years
Income
Poverty
Unemployment
Labor Participation
Family Structure
Vehicle Availability
Education Level
Disability

Unemployment Among Ages 55 to 59 years Comparison

Scottish

Immigrants from Panama

Exceptional
Good
4.5%
UNEMPLOYMENT AMONG AGES 55 TO 59 YEARS
99.7/ 100
METRIC RATING
52nd/ 347
METRIC RANK
4.8%
UNEMPLOYMENT AMONG AGES 55 TO 59 YEARS
66.8/ 100
METRIC RATING
154th/ 347
METRIC RANK

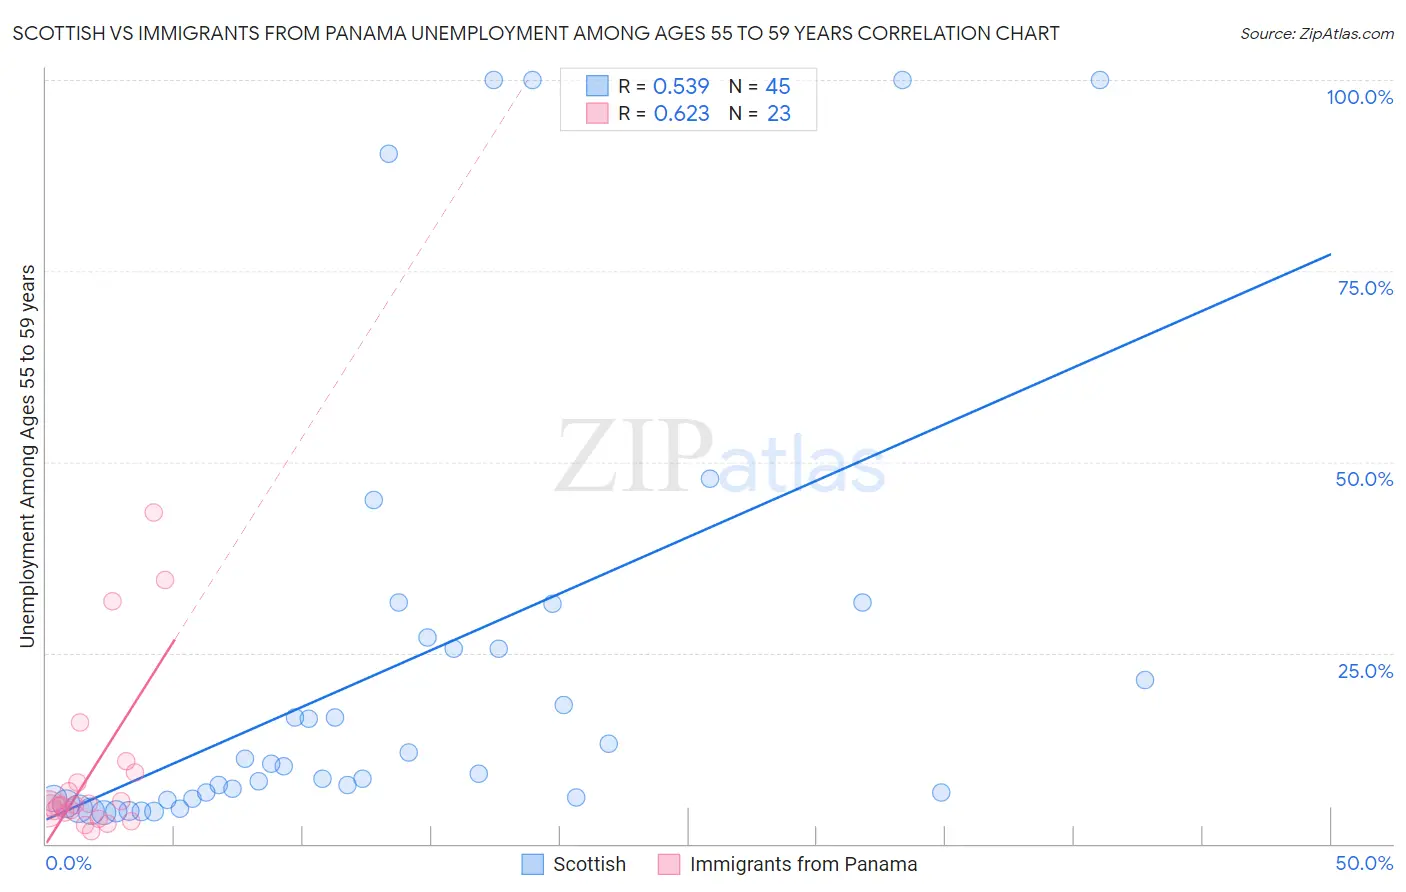
Scottish vs Immigrants from Panama Unemployment Among Ages 55 to 59 years Correlation Chart

The statistical analysis conducted on geographies consisting of 482,661,898 people shows a substantial positive correlation between the proportion of Scottish and unemployment rate among population between the ages 55 and 59 in the United States with a correlation coefficient (R) of 0.539 and weighted average of 4.5%. Similarly, the statistical analysis conducted on geographies consisting of 213,548,057 people shows a significant positive correlation between the proportion of Immigrants from Panama and unemployment rate among population between the ages 55 and 59 in the United States with a correlation coefficient (R) of 0.623 and weighted average of 4.8%, a difference of 5.4%.
Scottish vs Immigrants from Panama Unemployment Among Ages 55 to 59 years

Unemployment Among Ages 55 to 59 years Correlation Summary

MeasurementScottishImmigrants from Panama
Minimum4.1%1.7%
Maximum100.0%43.3%
Range95.9%41.6%
Mean23.0%9.6%
Median10.2%5.1%
Interquartile 25% (IQ1)5.9%4.1%
Interquartile 75% (IQ3)26.3%9.4%
Interquartile Range (IQR)20.4%5.3%
Standard Deviation (Sample)28.9%11.2%
Standard Deviation (Population)28.6%11.0%

Similar Demographics by Unemployment Among Ages 55 to 59 years

Demographics Similar to Scottish by Unemployment Among Ages 55 to 59 years

In terms of unemployment among ages 55 to 59 years, the demographic groups most similar to Scottish are Immigrants from Middle Africa (4.5%, a difference of 0.010%), Burmese (4.5%, a difference of 0.010%), Immigrants from Nepal (4.5%, a difference of 0.10%), Maltese (4.5%, a difference of 0.11%), and Immigrants from Pakistan (4.5%, a difference of 0.14%).
DemographicsRating | RankUnemployment Among Ages 55 to 59 years
British
99.8
/100
|
#45
Exceptional
4.5%
Immigrants | Zaire
99.8
/100
|
#46
Exceptional
4.5%
German Russians
99.8
/100
|
#47
Exceptional
4.5%
Immigrants | Moldova
99.7
/100
|
#48
Exceptional
4.5%
Immigrants | Saudi Arabia
99.7
/100
|
#49
Exceptional
4.5%
Immigrants | Pakistan
99.7
/100
|
#50
Exceptional
4.5%
Maltese
99.7
/100
|
#51
Exceptional
4.5%
Scottish
99.7
/100
|
#52
Exceptional
4.5%
Immigrants | Middle Africa
99.7
/100
|
#53
Exceptional
4.5%
Burmese
99.7
/100
|
#54
Exceptional
4.5%
Immigrants | Nepal
99.6
/100
|
#55
Exceptional
4.5%
Welsh
99.6
/100
|
#56
Exceptional
4.5%
Northern Europeans
99.6
/100
|
#57
Exceptional
4.5%
Okinawans
99.6
/100
|
#58
Exceptional
4.5%
Immigrants | Uganda
99.5
/100
|
#59
Exceptional
4.6%

Demographics Similar to Immigrants from Panama by Unemployment Among Ages 55 to 59 years

In terms of unemployment among ages 55 to 59 years, the demographic groups most similar to Immigrants from Panama are Immigrants from Uruguay (4.8%, a difference of 0.020%), Immigrants from North Macedonia (4.8%, a difference of 0.020%), Italian (4.8%, a difference of 0.030%), Carpatho Rusyn (4.8%, a difference of 0.040%), and Laotian (4.8%, a difference of 0.070%).
DemographicsRating | RankUnemployment Among Ages 55 to 59 years
Immigrants | Singapore
76.6
/100
|
#147
Good
4.8%
Immigrants | Bahamas
71.8
/100
|
#148
Good
4.8%
Immigrants | Lithuania
70.8
/100
|
#149
Good
4.8%
Immigrants | Northern Africa
69.8
/100
|
#150
Good
4.8%
Bahamians
68.6
/100
|
#151
Good
4.8%
Laotians
68.2
/100
|
#152
Good
4.8%
Immigrants | Uruguay
67.2
/100
|
#153
Good
4.8%
Immigrants | Panama
66.8
/100
|
#154
Good
4.8%
Immigrants | North Macedonia
66.3
/100
|
#155
Good
4.8%
Italians
66.2
/100
|
#156
Good
4.8%
Carpatho Rusyns
66.0
/100
|
#157
Good
4.8%
Slovaks
65.3
/100
|
#158
Good
4.8%
Immigrants | Nicaragua
65.2
/100
|
#159
Good
4.8%
Chickasaw
65.1
/100
|
#160
Good
4.8%
Koreans
64.6
/100
|
#161
Good
4.8%