Scottish vs Immigrants from Dominican Republic Householder Income Ages 25 - 44 years
COMPARE
Scottish
Immigrants from Dominican Republic
Householder Income Ages 25 - 44 years
Householder Income Ages 25 - 44 years Comparison
Scottish
Immigrants from Dominican Republic
$94,622
HOUSEHOLDER INCOME AGES 25 - 44 YEARS
50.8/ 100
METRIC RATING
172nd/ 347
METRIC RANK
$80,319
HOUSEHOLDER INCOME AGES 25 - 44 YEARS
0.0/ 100
METRIC RATING
305th/ 347
METRIC RANK
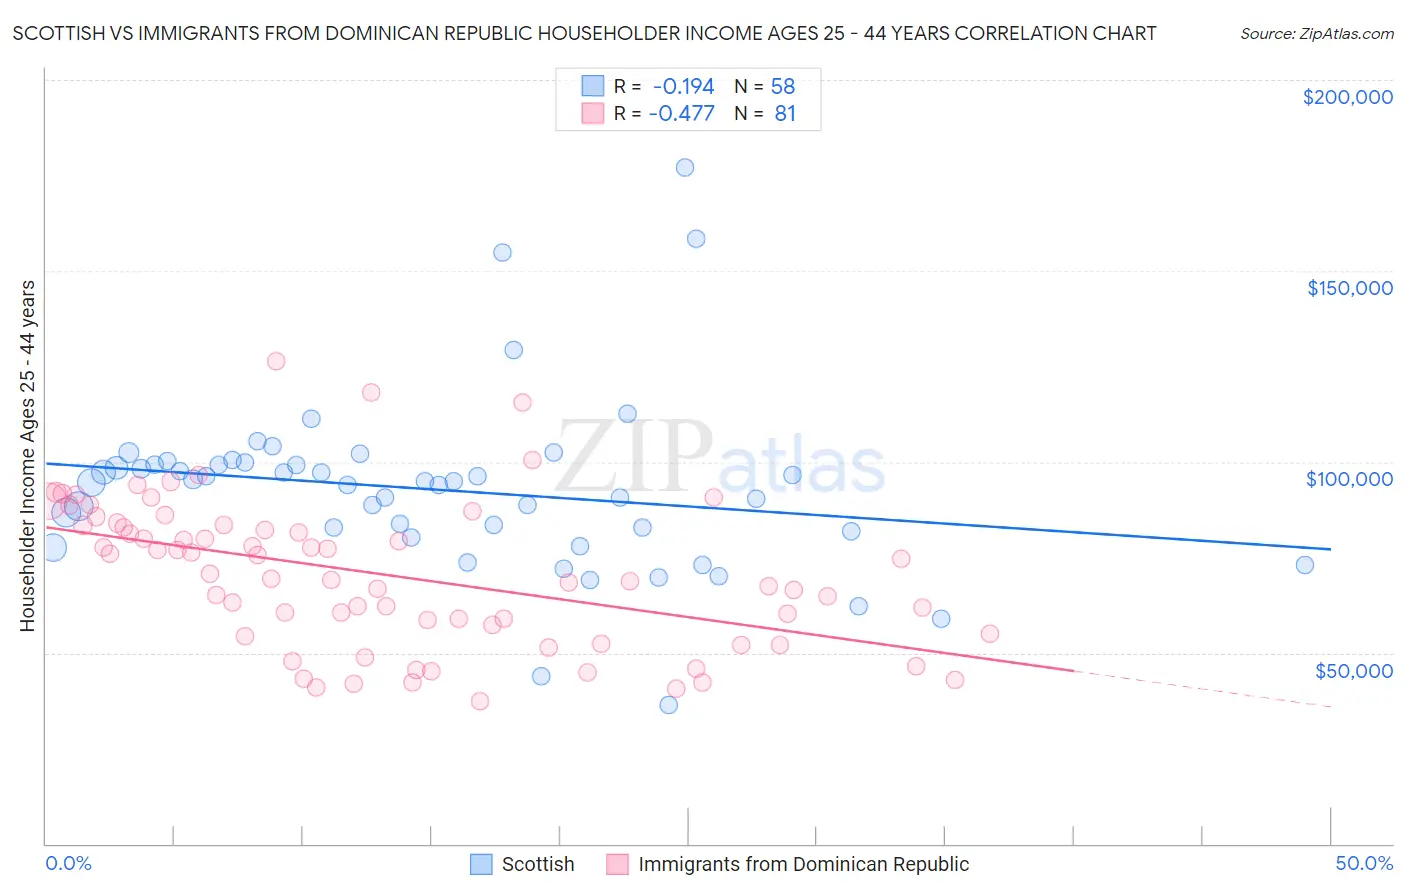
Scottish vs Immigrants from Dominican Republic Householder Income Ages 25 - 44 years Correlation Chart
The statistical analysis conducted on geographies consisting of 561,360,199 people shows a poor negative correlation between the proportion of Scottish and household income with householder between the ages 25 and 44 in the United States with a correlation coefficient (R) of -0.194 and weighted average of $94,622. Similarly, the statistical analysis conducted on geographies consisting of 274,672,798 people shows a moderate negative correlation between the proportion of Immigrants from Dominican Republic and household income with householder between the ages 25 and 44 in the United States with a correlation coefficient (R) of -0.477 and weighted average of $80,319, a difference of 17.8%.
Householder Income Ages 25 - 44 years Correlation Summary
| Measurement | Scottish | Immigrants from Dominican Republic |
| Minimum | $36,186 | $37,215 |
| Maximum | $177,052 | $126,257 |
| Range | $140,866 | $89,042 |
| Mean | $92,714 | $70,454 |
| Median | $94,762 | $69,254 |
| Interquartile 25% (IQ1) | $81,966 | $54,727 |
| Interquartile 75% (IQ3) | $99,308 | $83,452 |
| Interquartile Range (IQR) | $17,342 | $28,725 |
| Standard Deviation (Sample) | $23,114 | $19,333 |
| Standard Deviation (Population) | $22,914 | $19,213 |
Similar Demographics by Householder Income Ages 25 - 44 years
Demographics Similar to Scottish by Householder Income Ages 25 - 44 years
In terms of householder income ages 25 - 44 years, the demographic groups most similar to Scottish are Finnish ($94,610, a difference of 0.010%), Colombian ($94,565, a difference of 0.060%), English ($94,429, a difference of 0.21%), Immigrants ($94,423, a difference of 0.21%), and Immigrants from Armenia ($94,867, a difference of 0.26%).
| Demographics | Rating | Rank | Householder Income Ages 25 - 44 years |
| Immigrants | Nepal | 60.3 /100 | #165 | Good $95,322 |
| Immigrants | Ethiopia | 59.5 /100 | #166 | Average $95,256 |
| Czechoslovakians | 57.0 /100 | #167 | Average $95,070 |
| Alsatians | 56.8 /100 | #168 | Average $95,059 |
| Native Hawaiians | 56.8 /100 | #169 | Average $95,058 |
| Slovaks | 56.4 /100 | #170 | Average $95,032 |
| Immigrants | Armenia | 54.2 /100 | #171 | Average $94,867 |
| Scottish | 50.8 /100 | #172 | Average $94,622 |
| Finns | 50.6 /100 | #173 | Average $94,610 |
| Colombians | 50.0 /100 | #174 | Average $94,565 |
| English | 48.1 /100 | #175 | Average $94,429 |
| Immigrants | Immigrants | 48.0 /100 | #176 | Average $94,423 |
| Belgians | 45.8 /100 | #177 | Average $94,262 |
| Immigrants | South America | 42.8 /100 | #178 | Average $94,042 |
| French Canadians | 38.2 /100 | #179 | Fair $93,694 |
Demographics Similar to Immigrants from Dominican Republic by Householder Income Ages 25 - 44 years
In terms of householder income ages 25 - 44 years, the demographic groups most similar to Immigrants from Dominican Republic are Immigrants from Caribbean ($80,326, a difference of 0.010%), Apache ($80,260, a difference of 0.070%), Mexican ($80,427, a difference of 0.13%), Hispanic or Latino ($80,515, a difference of 0.24%), and Immigrants from Micronesia ($80,544, a difference of 0.28%).
| Demographics | Rating | Rank | Householder Income Ages 25 - 44 years |
| Dominicans | 0.1 /100 | #298 | Tragic $81,229 |
| Immigrants | Liberia | 0.1 /100 | #299 | Tragic $80,863 |
| Cherokee | 0.0 /100 | #300 | Tragic $80,843 |
| Immigrants | Micronesia | 0.0 /100 | #301 | Tragic $80,544 |
| Hispanics or Latinos | 0.0 /100 | #302 | Tragic $80,515 |
| Mexicans | 0.0 /100 | #303 | Tragic $80,427 |
| Immigrants | Caribbean | 0.0 /100 | #304 | Tragic $80,326 |
| Immigrants | Dominican Republic | 0.0 /100 | #305 | Tragic $80,319 |
| Apache | 0.0 /100 | #306 | Tragic $80,260 |
| Haitians | 0.0 /100 | #307 | Tragic $80,055 |
| Immigrants | Central America | 0.0 /100 | #308 | Tragic $80,012 |
| Chippewa | 0.0 /100 | #309 | Tragic $80,005 |
| Fijians | 0.0 /100 | #310 | Tragic $79,956 |
| Indonesians | 0.0 /100 | #311 | Tragic $79,543 |
| Immigrants | Haiti | 0.0 /100 | #312 | Tragic $79,391 |