Immigrants from Zaire vs Immigrants from Panama Householder Income Ages 25 - 44 years
COMPARE
Immigrants from Zaire
Immigrants from Panama
Householder Income Ages 25 - 44 years
Householder Income Ages 25 - 44 years Comparison
Immigrants from Zaire
Immigrants from Panama
$78,045
HOUSEHOLDER INCOME AGES 25 - 44 YEARS
0.0/ 100
METRIC RATING
321st/ 347
METRIC RANK
$89,451
HOUSEHOLDER INCOME AGES 25 - 44 YEARS
5.5/ 100
METRIC RATING
225th/ 347
METRIC RANK
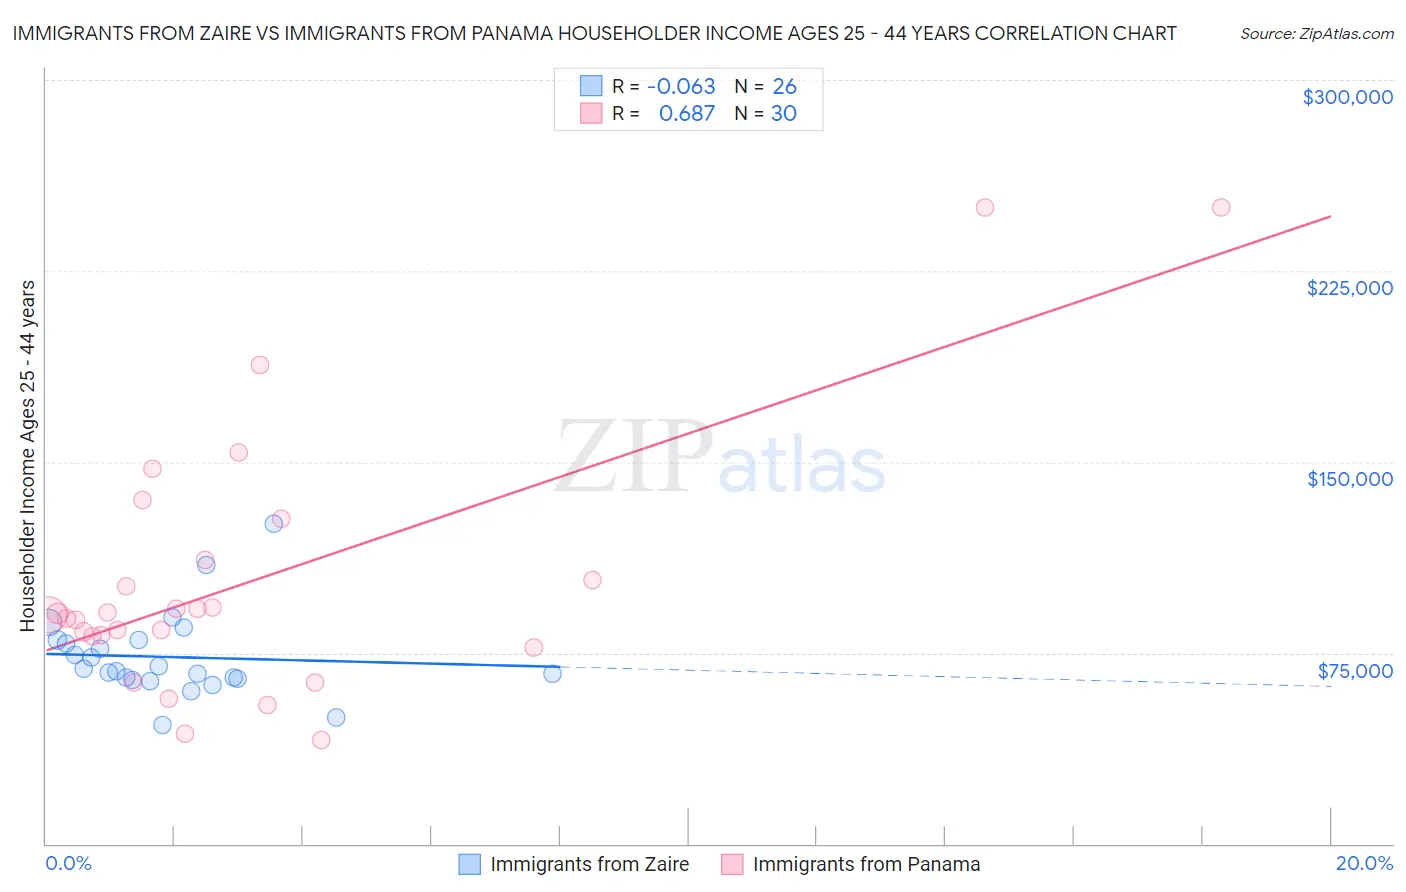
Immigrants from Zaire vs Immigrants from Panama Householder Income Ages 25 - 44 years Correlation Chart
The statistical analysis conducted on geographies consisting of 107,186,702 people shows a slight negative correlation between the proportion of Immigrants from Zaire and household income with householder between the ages 25 and 44 in the United States with a correlation coefficient (R) of -0.063 and weighted average of $78,045. Similarly, the statistical analysis conducted on geographies consisting of 221,047,816 people shows a significant positive correlation between the proportion of Immigrants from Panama and household income with householder between the ages 25 and 44 in the United States with a correlation coefficient (R) of 0.687 and weighted average of $89,451, a difference of 14.6%.
Householder Income Ages 25 - 44 years Correlation Summary
| Measurement | Immigrants from Zaire | Immigrants from Panama |
| Minimum | $46,875 | $40,673 |
| Maximum | $125,889 | $250,001 |
| Range | $79,014 | $209,328 |
| Mean | $73,350 | $103,544 |
| Median | $68,084 | $90,149 |
| Interquartile 25% (IQ1) | $64,948 | $81,630 |
| Interquartile 75% (IQ3) | $79,800 | $111,639 |
| Interquartile Range (IQR) | $14,852 | $30,009 |
| Standard Deviation (Sample) | $16,583 | $51,093 |
| Standard Deviation (Population) | $16,261 | $50,234 |
Similar Demographics by Householder Income Ages 25 - 44 years
Demographics Similar to Immigrants from Zaire by Householder Income Ages 25 - 44 years
In terms of householder income ages 25 - 44 years, the demographic groups most similar to Immigrants from Zaire are Chickasaw ($77,929, a difference of 0.15%), Choctaw ($78,168, a difference of 0.16%), Honduran ($78,540, a difference of 0.63%), Immigrants from Honduras ($77,328, a difference of 0.93%), and Immigrants from Mexico ($78,809, a difference of 0.98%).
| Demographics | Rating | Rank | Householder Income Ages 25 - 44 years |
| Cheyenne | 0.0 /100 | #314 | Tragic $79,152 |
| Ottawa | 0.0 /100 | #315 | Tragic $79,012 |
| Africans | 0.0 /100 | #316 | Tragic $78,986 |
| U.S. Virgin Islanders | 0.0 /100 | #317 | Tragic $78,911 |
| Immigrants | Mexico | 0.0 /100 | #318 | Tragic $78,809 |
| Hondurans | 0.0 /100 | #319 | Tragic $78,540 |
| Choctaw | 0.0 /100 | #320 | Tragic $78,168 |
| Immigrants | Zaire | 0.0 /100 | #321 | Tragic $78,045 |
| Chickasaw | 0.0 /100 | #322 | Tragic $77,929 |
| Immigrants | Honduras | 0.0 /100 | #323 | Tragic $77,328 |
| Dutch West Indians | 0.0 /100 | #324 | Tragic $77,260 |
| Sioux | 0.0 /100 | #325 | Tragic $77,089 |
| Houma | 0.0 /100 | #326 | Tragic $77,044 |
| Immigrants | Bahamas | 0.0 /100 | #327 | Tragic $76,910 |
| Immigrants | Cuba | 0.0 /100 | #328 | Tragic $76,701 |
Demographics Similar to Immigrants from Panama by Householder Income Ages 25 - 44 years
In terms of householder income ages 25 - 44 years, the demographic groups most similar to Immigrants from Panama are Immigrants from Iraq ($89,444, a difference of 0.010%), Barbadian ($89,565, a difference of 0.13%), Immigrants from Guyana ($89,586, a difference of 0.15%), Immigrants from Ecuador ($89,673, a difference of 0.25%), and Immigrants from Trinidad and Tobago ($89,748, a difference of 0.33%).
| Demographics | Rating | Rank | Householder Income Ages 25 - 44 years |
| Guyanese | 7.1 /100 | #218 | Tragic $89,940 |
| Delaware | 6.9 /100 | #219 | Tragic $89,876 |
| Trinidadians and Tobagonians | 6.8 /100 | #220 | Tragic $89,856 |
| Immigrants | Trinidad and Tobago | 6.5 /100 | #221 | Tragic $89,748 |
| Immigrants | Ecuador | 6.2 /100 | #222 | Tragic $89,673 |
| Immigrants | Guyana | 5.9 /100 | #223 | Tragic $89,586 |
| Barbadians | 5.9 /100 | #224 | Tragic $89,565 |
| Immigrants | Panama | 5.5 /100 | #225 | Tragic $89,451 |
| Immigrants | Iraq | 5.5 /100 | #226 | Tragic $89,444 |
| Immigrants | St. Vincent and the Grenadines | 4.1 /100 | #227 | Tragic $88,888 |
| Immigrants | Bosnia and Herzegovina | 4.0 /100 | #228 | Tragic $88,819 |
| Immigrants | Barbados | 3.7 /100 | #229 | Tragic $88,687 |
| Alaskan Athabascans | 3.3 /100 | #230 | Tragic $88,446 |
| Immigrants | Grenada | 3.0 /100 | #231 | Tragic $88,311 |
| Immigrants | Nonimmigrants | 3.0 /100 | #232 | Tragic $88,301 |