Scottish vs Immigrants from Panama Vision Disability
COMPARE
Scottish
Immigrants from Panama
Vision Disability
Vision Disability Comparison
Scottish
Immigrants from Panama
2.3%
VISION DISABILITY
1.6/ 100
METRIC RATING
234th/ 347
METRIC RANK
2.3%
VISION DISABILITY
0.8/ 100
METRIC RATING
242nd/ 347
METRIC RANK
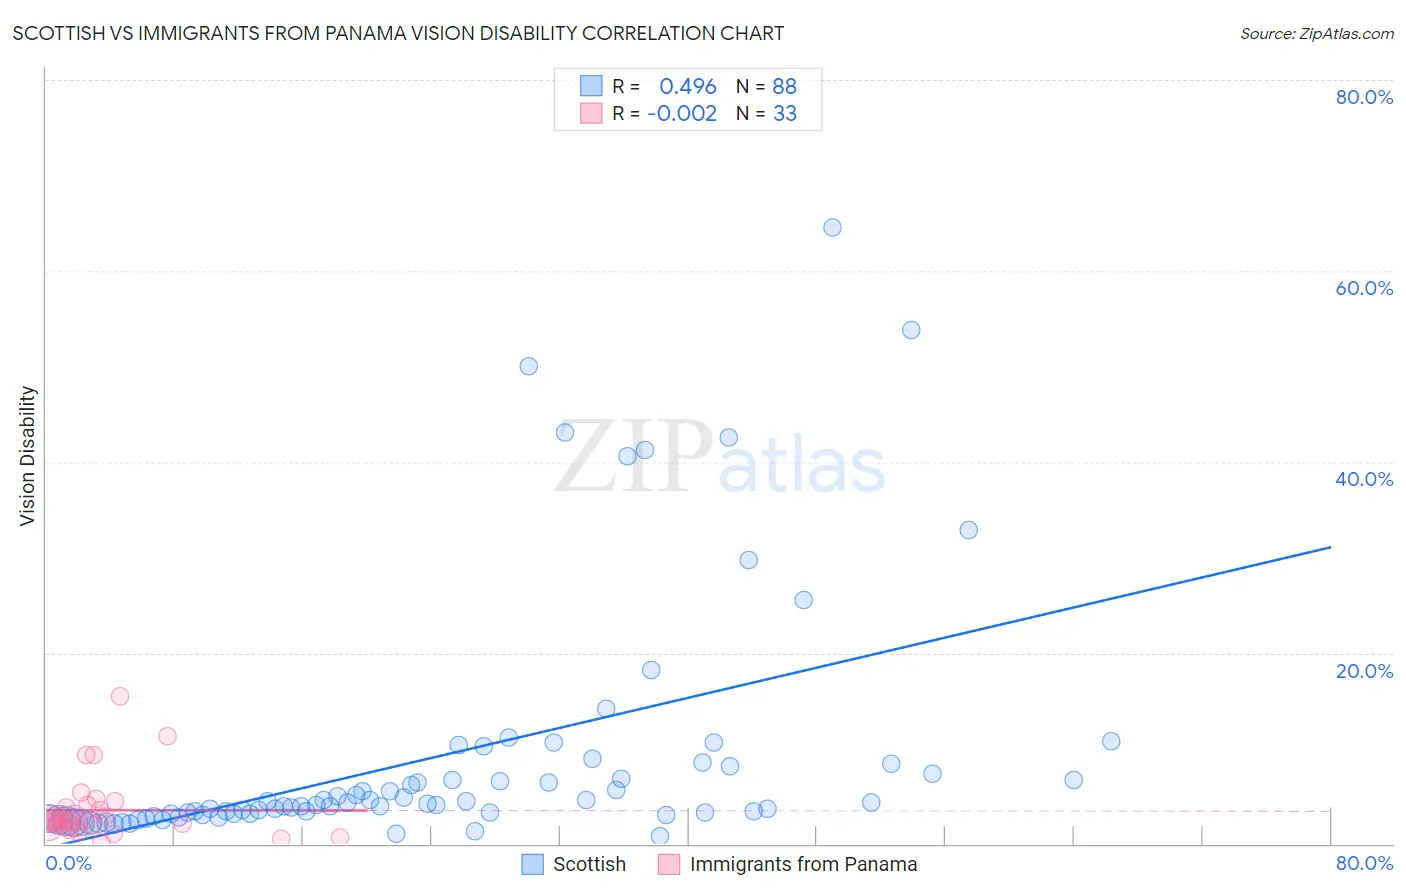
Scottish vs Immigrants from Panama Vision Disability Correlation Chart
The statistical analysis conducted on geographies consisting of 565,142,315 people shows a moderate positive correlation between the proportion of Scottish and percentage of population with vision disability in the United States with a correlation coefficient (R) of 0.496 and weighted average of 2.3%. Similarly, the statistical analysis conducted on geographies consisting of 221,144,457 people shows no correlation between the proportion of Immigrants from Panama and percentage of population with vision disability in the United States with a correlation coefficient (R) of -0.002 and weighted average of 2.3%, a difference of 0.93%.
Vision Disability Correlation Summary
| Measurement | Scottish | Immigrants from Panama |
| Minimum | 0.83% | 0.19% |
| Maximum | 64.6% | 15.5% |
| Range | 63.8% | 15.3% |
| Mean | 9.1% | 3.5% |
| Median | 4.1% | 2.3% |
| Interquartile 25% (IQ1) | 3.0% | 1.9% |
| Interquartile 75% (IQ3) | 7.7% | 3.9% |
| Interquartile Range (IQR) | 4.7% | 1.9% |
| Standard Deviation (Sample) | 12.9% | 3.3% |
| Standard Deviation (Population) | 12.8% | 3.2% |
Demographics Similar to Scottish and Immigrants from Panama by Vision Disability
In terms of vision disability, the demographic groups most similar to Scottish are Marshallese (2.3%, a difference of 0.070%), Immigrants from Congo (2.3%, a difference of 0.16%), Central American (2.3%, a difference of 0.18%), German Russian (2.3%, a difference of 0.20%), and Immigrants from Portugal (2.3%, a difference of 0.21%). Similarly, the demographic groups most similar to Immigrants from Panama are Malaysian (2.3%, a difference of 0.14%), Panamanian (2.3%, a difference of 0.18%), English (2.3%, a difference of 0.43%), Immigrants from Cambodia (2.3%, a difference of 0.45%), and Immigrants from Nicaragua (2.3%, a difference of 0.48%).
| Demographics | Rating | Rank | Vision Disability |
| Hmong | 2.5 /100 | #228 | Tragic 2.3% |
| Welsh | 2.3 /100 | #229 | Tragic 2.3% |
| Nicaraguans | 2.2 /100 | #230 | Tragic 2.3% |
| Immigrants | Ecuador | 2.0 /100 | #231 | Tragic 2.3% |
| German Russians | 1.8 /100 | #232 | Tragic 2.3% |
| Central Americans | 1.8 /100 | #233 | Tragic 2.3% |
| Scottish | 1.6 /100 | #234 | Tragic 2.3% |
| Marshallese | 1.5 /100 | #235 | Tragic 2.3% |
| Immigrants | Congo | 1.4 /100 | #236 | Tragic 2.3% |
| Immigrants | Portugal | 1.4 /100 | #237 | Tragic 2.3% |
| Immigrants | Cambodia | 1.1 /100 | #238 | Tragic 2.3% |
| English | 1.1 /100 | #239 | Tragic 2.3% |
| Panamanians | 0.9 /100 | #240 | Tragic 2.3% |
| Malaysians | 0.9 /100 | #241 | Tragic 2.3% |
| Immigrants | Panama | 0.8 /100 | #242 | Tragic 2.3% |
| Immigrants | Nicaragua | 0.6 /100 | #243 | Tragic 2.3% |
| Immigrants | West Indies | 0.6 /100 | #244 | Tragic 2.3% |
| Alsatians | 0.6 /100 | #245 | Tragic 2.3% |
| French | 0.5 /100 | #246 | Tragic 2.3% |
| Guatemalans | 0.5 /100 | #247 | Tragic 2.3% |
| Sub-Saharan Africans | 0.5 /100 | #248 | Tragic 2.3% |