Immigrants from Bangladesh vs Immigrants from Panama Householder Income Ages 25 - 44 years
COMPARE
Immigrants from Bangladesh
Immigrants from Panama
Householder Income Ages 25 - 44 years
Householder Income Ages 25 - 44 years Comparison
Immigrants from Bangladesh
Immigrants from Panama
$90,448
HOUSEHOLDER INCOME AGES 25 - 44 YEARS
9.3/ 100
METRIC RATING
213th/ 347
METRIC RANK
$89,451
HOUSEHOLDER INCOME AGES 25 - 44 YEARS
5.5/ 100
METRIC RATING
225th/ 347
METRIC RANK
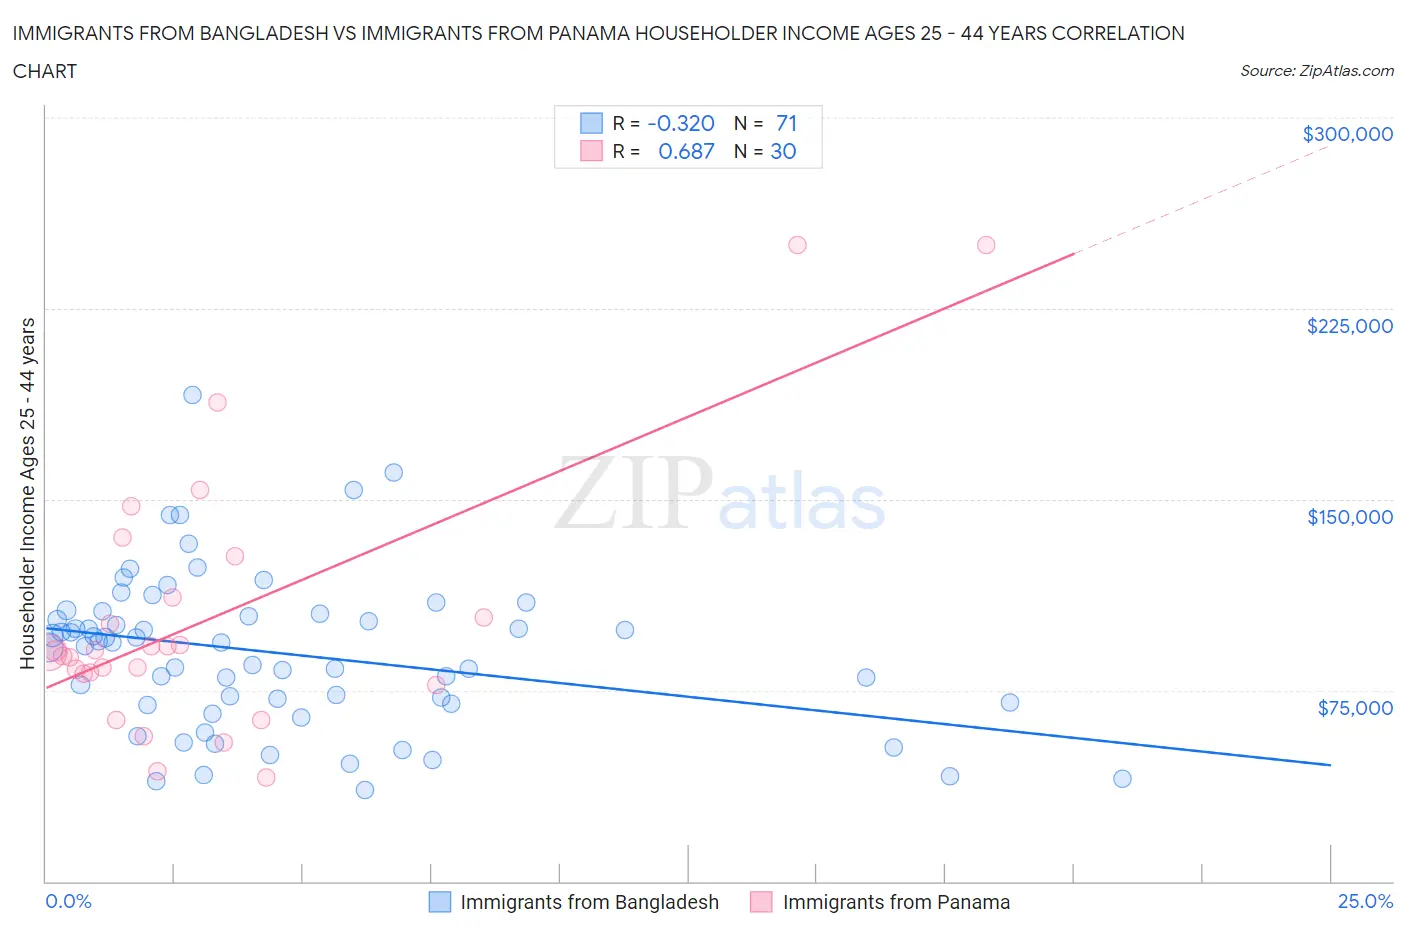
Immigrants from Bangladesh vs Immigrants from Panama Householder Income Ages 25 - 44 years Correlation Chart
The statistical analysis conducted on geographies consisting of 203,449,247 people shows a mild negative correlation between the proportion of Immigrants from Bangladesh and household income with householder between the ages 25 and 44 in the United States with a correlation coefficient (R) of -0.320 and weighted average of $90,448. Similarly, the statistical analysis conducted on geographies consisting of 221,047,816 people shows a significant positive correlation between the proportion of Immigrants from Panama and household income with householder between the ages 25 and 44 in the United States with a correlation coefficient (R) of 0.687 and weighted average of $89,451, a difference of 1.1%.
Householder Income Ages 25 - 44 years Correlation Summary
| Measurement | Immigrants from Bangladesh | Immigrants from Panama |
| Minimum | $35,868 | $40,673 |
| Maximum | $191,104 | $250,001 |
| Range | $155,236 | $209,328 |
| Mean | $89,510 | $103,544 |
| Median | $93,714 | $90,149 |
| Interquartile 25% (IQ1) | $69,551 | $81,630 |
| Interquartile 75% (IQ3) | $104,853 | $111,639 |
| Interquartile Range (IQR) | $35,302 | $30,009 |
| Standard Deviation (Sample) | $30,547 | $51,093 |
| Standard Deviation (Population) | $30,331 | $50,234 |
Demographics Similar to Immigrants from Bangladesh and Immigrants from Panama by Householder Income Ages 25 - 44 years
In terms of householder income ages 25 - 44 years, the demographic groups most similar to Immigrants from Bangladesh are Immigrants from Africa ($90,372, a difference of 0.090%), Panamanian ($90,193, a difference of 0.28%), Hawaiian ($90,722, a difference of 0.30%), Immigrants from Kenya ($90,767, a difference of 0.35%), and Iraqi ($90,764, a difference of 0.35%). Similarly, the demographic groups most similar to Immigrants from Panama are Immigrants from Iraq ($89,444, a difference of 0.010%), Barbadian ($89,565, a difference of 0.13%), Immigrants from Guyana ($89,586, a difference of 0.15%), Immigrants from Ecuador ($89,673, a difference of 0.25%), and Immigrants from Trinidad and Tobago ($89,748, a difference of 0.33%).
| Demographics | Rating | Rank | Householder Income Ages 25 - 44 years |
| Immigrants | Uruguay | 13.2 /100 | #209 | Poor $91,171 |
| Immigrants | Kenya | 10.9 /100 | #210 | Poor $90,767 |
| Iraqis | 10.8 /100 | #211 | Poor $90,764 |
| Hawaiians | 10.6 /100 | #212 | Poor $90,722 |
| Immigrants | Bangladesh | 9.3 /100 | #213 | Tragic $90,448 |
| Immigrants | Africa | 8.9 /100 | #214 | Tragic $90,372 |
| Panamanians | 8.1 /100 | #215 | Tragic $90,193 |
| Ghanaians | 7.9 /100 | #216 | Tragic $90,137 |
| Scotch-Irish | 7.3 /100 | #217 | Tragic $89,969 |
| Guyanese | 7.1 /100 | #218 | Tragic $89,940 |
| Delaware | 6.9 /100 | #219 | Tragic $89,876 |
| Trinidadians and Tobagonians | 6.8 /100 | #220 | Tragic $89,856 |
| Immigrants | Trinidad and Tobago | 6.5 /100 | #221 | Tragic $89,748 |
| Immigrants | Ecuador | 6.2 /100 | #222 | Tragic $89,673 |
| Immigrants | Guyana | 5.9 /100 | #223 | Tragic $89,586 |
| Barbadians | 5.9 /100 | #224 | Tragic $89,565 |
| Immigrants | Panama | 5.5 /100 | #225 | Tragic $89,451 |
| Immigrants | Iraq | 5.5 /100 | #226 | Tragic $89,444 |
| Immigrants | St. Vincent and the Grenadines | 4.1 /100 | #227 | Tragic $88,888 |
| Immigrants | Bosnia and Herzegovina | 4.0 /100 | #228 | Tragic $88,819 |
| Immigrants | Barbados | 3.7 /100 | #229 | Tragic $88,687 |