Scottish vs Immigrants from Denmark Wage/Income Gap
COMPARE
Scottish
Immigrants from Denmark
Wage/Income Gap
Wage/Income Gap Comparison
Scottish
Immigrants from Denmark
29.1%
WAGE/INCOME GAP
0.0/ 100
METRIC RATING
329th/ 347
METRIC RANK
28.5%
WAGE/INCOME GAP
0.1/ 100
METRIC RATING
307th/ 347
METRIC RANK
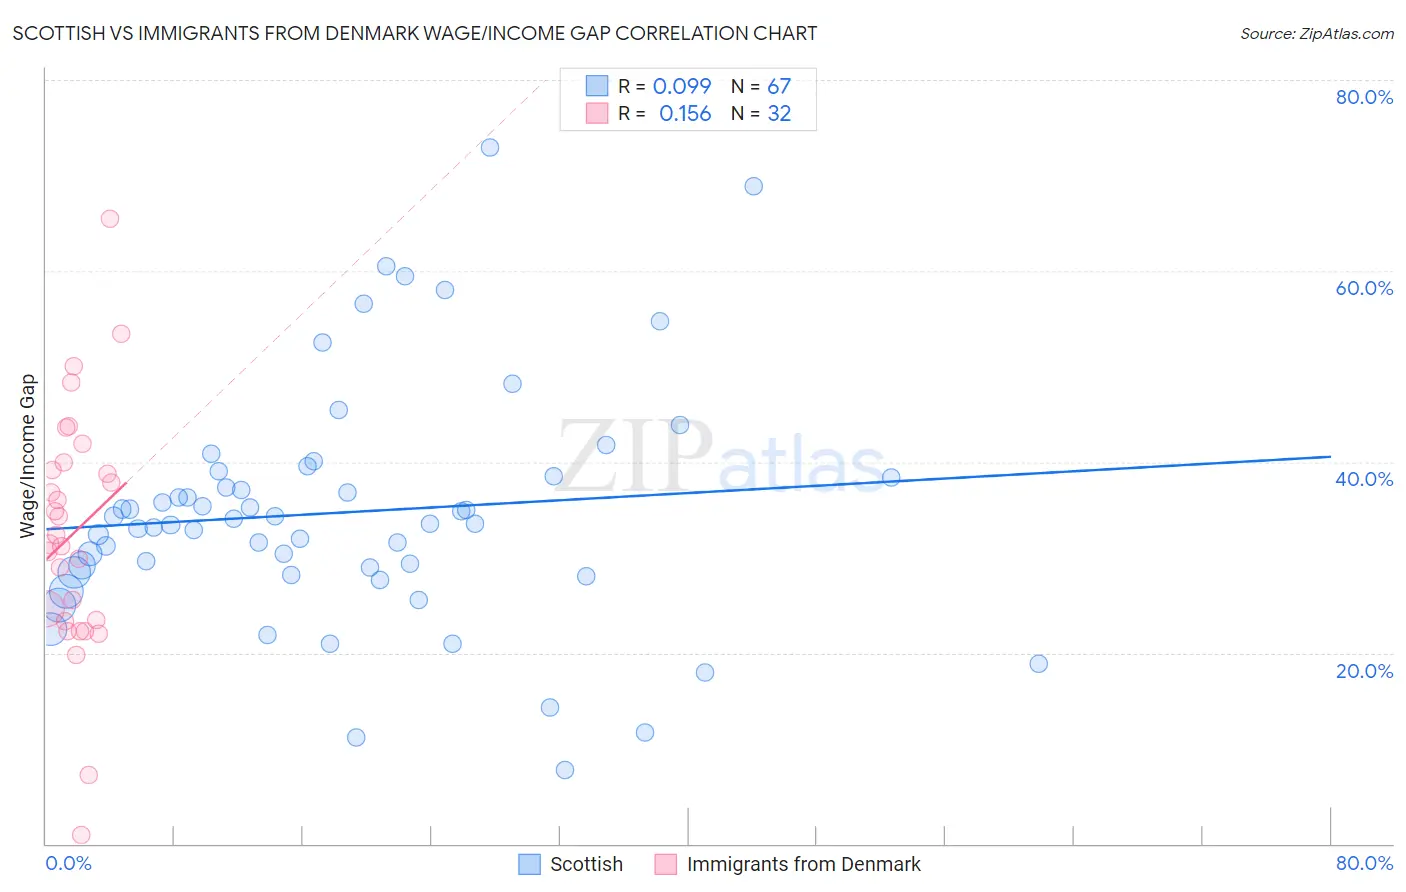
Scottish vs Immigrants from Denmark Wage/Income Gap Correlation Chart
The statistical analysis conducted on geographies consisting of 564,295,282 people shows a slight positive correlation between the proportion of Scottish and wage/income gap percentage in the United States with a correlation coefficient (R) of 0.099 and weighted average of 29.1%. Similarly, the statistical analysis conducted on geographies consisting of 136,393,196 people shows a poor positive correlation between the proportion of Immigrants from Denmark and wage/income gap percentage in the United States with a correlation coefficient (R) of 0.156 and weighted average of 28.5%, a difference of 2.2%.
Wage/Income Gap Correlation Summary
| Measurement | Scottish | Immigrants from Denmark |
| Minimum | 7.8% | 0.92% |
| Maximum | 73.0% | 65.5% |
| Range | 65.2% | 64.6% |
| Mean | 34.7% | 32.6% |
| Median | 33.5% | 31.9% |
| Interquartile 25% (IQ1) | 28.4% | 23.4% |
| Interquartile 75% (IQ3) | 38.5% | 39.5% |
| Interquartile Range (IQR) | 10.1% | 16.2% |
| Standard Deviation (Sample) | 12.5% | 12.9% |
| Standard Deviation (Population) | 12.4% | 12.7% |
Similar Demographics by Wage/Income Gap
Demographics Similar to Scottish by Wage/Income Gap
In terms of wage/income gap, the demographic groups most similar to Scottish are German (29.2%, a difference of 0.10%), Scandinavian (29.1%, a difference of 0.14%), Czech (29.2%, a difference of 0.15%), Immigrants from Iran (29.1%, a difference of 0.20%), and Immigrants from Belgium (29.0%, a difference of 0.31%).
| Demographics | Rating | Rank | Wage/Income Gap |
| Immigrants | Singapore | 0.1 /100 | #322 | Tragic 28.9% |
| Norwegians | 0.1 /100 | #323 | Tragic 29.0% |
| Croatians | 0.0 /100 | #324 | Tragic 29.0% |
| Hungarians | 0.0 /100 | #325 | Tragic 29.0% |
| Immigrants | Belgium | 0.0 /100 | #326 | Tragic 29.0% |
| Immigrants | Iran | 0.0 /100 | #327 | Tragic 29.1% |
| Scandinavians | 0.0 /100 | #328 | Tragic 29.1% |
| Scottish | 0.0 /100 | #329 | Tragic 29.1% |
| Germans | 0.0 /100 | #330 | Tragic 29.2% |
| Czechs | 0.0 /100 | #331 | Tragic 29.2% |
| Immigrants | South Central Asia | 0.0 /100 | #332 | Tragic 29.3% |
| Europeans | 0.0 /100 | #333 | Tragic 29.4% |
| Swedes | 0.0 /100 | #334 | Tragic 29.4% |
| Immigrants | Taiwan | 0.0 /100 | #335 | Tragic 29.5% |
| English | 0.0 /100 | #336 | Tragic 29.5% |
Demographics Similar to Immigrants from Denmark by Wage/Income Gap
In terms of wage/income gap, the demographic groups most similar to Immigrants from Denmark are White/Caucasian (28.5%, a difference of 0.010%), Immigrants from South Africa (28.5%, a difference of 0.050%), Immigrants from Netherlands (28.5%, a difference of 0.070%), Polish (28.5%, a difference of 0.070%), and Scotch-Irish (28.5%, a difference of 0.15%).
| Demographics | Rating | Rank | Wage/Income Gap |
| Immigrants | Northern Europe | 0.2 /100 | #300 | Tragic 28.5% |
| Immigrants | Canada | 0.2 /100 | #301 | Tragic 28.5% |
| Scotch-Irish | 0.2 /100 | #302 | Tragic 28.5% |
| Irish | 0.2 /100 | #303 | Tragic 28.5% |
| Immigrants | Netherlands | 0.2 /100 | #304 | Tragic 28.5% |
| Immigrants | South Africa | 0.1 /100 | #305 | Tragic 28.5% |
| Whites/Caucasians | 0.1 /100 | #306 | Tragic 28.5% |
| Immigrants | Denmark | 0.1 /100 | #307 | Tragic 28.5% |
| Poles | 0.1 /100 | #308 | Tragic 28.5% |
| Macedonians | 0.1 /100 | #309 | Tragic 28.6% |
| Finns | 0.1 /100 | #310 | Tragic 28.6% |
| Immigrants | Lithuania | 0.1 /100 | #311 | Tragic 28.6% |
| Eastern Europeans | 0.1 /100 | #312 | Tragic 28.6% |
| French | 0.1 /100 | #313 | Tragic 28.7% |
| Immigrants | Scotland | 0.1 /100 | #314 | Tragic 28.7% |