Immigrants from Trinidad and Tobago vs Comanche Median Family Income
COMPARE
Immigrants from Trinidad and Tobago
Comanche
Median Family Income
Median Family Income Comparison
Immigrants from Trinidad and Tobago
Comanche
$93,988
MEDIAN FAMILY INCOME
1.2/ 100
METRIC RATING
241st/ 347
METRIC RANK
$88,556
MEDIAN FAMILY INCOME
0.1/ 100
METRIC RATING
282nd/ 347
METRIC RANK
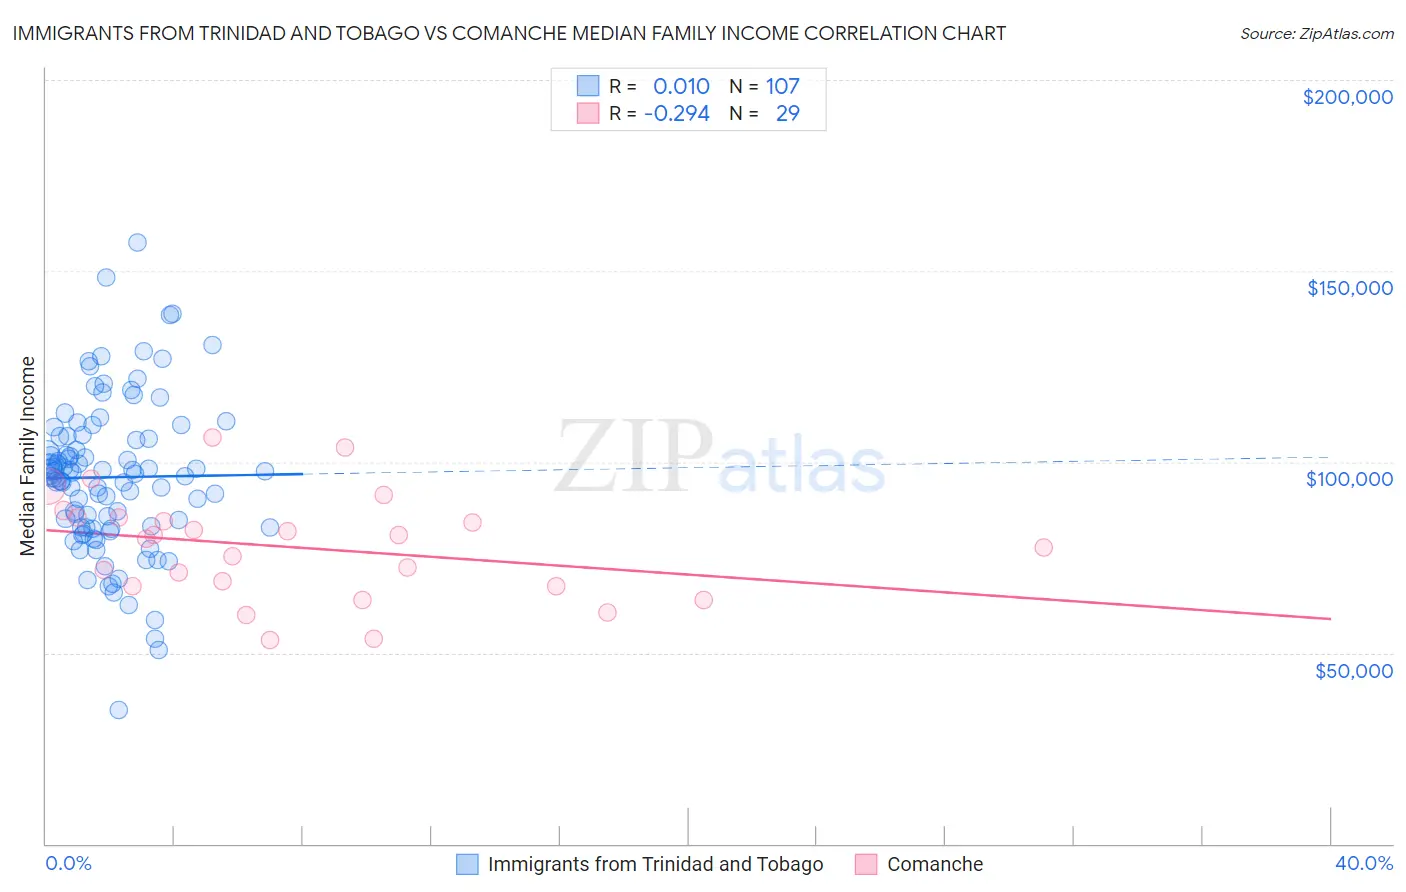
Immigrants from Trinidad and Tobago vs Comanche Median Family Income Correlation Chart
The statistical analysis conducted on geographies consisting of 223,463,571 people shows no correlation between the proportion of Immigrants from Trinidad and Tobago and median family income in the United States with a correlation coefficient (R) of 0.010 and weighted average of $93,988. Similarly, the statistical analysis conducted on geographies consisting of 109,751,078 people shows a weak negative correlation between the proportion of Comanche and median family income in the United States with a correlation coefficient (R) of -0.294 and weighted average of $88,556, a difference of 6.1%.
Median Family Income Correlation Summary
| Measurement | Immigrants from Trinidad and Tobago | Comanche |
| Minimum | $35,148 | $53,472 |
| Maximum | $157,500 | $106,375 |
| Range | $122,352 | $52,903 |
| Mean | $95,978 | $77,578 |
| Median | $96,780 | $79,900 |
| Interquartile 25% (IQ1) | $82,831 | $67,370 |
| Interquartile 75% (IQ3) | $106,554 | $85,455 |
| Interquartile Range (IQR) | $23,723 | $18,086 |
| Standard Deviation (Sample) | $20,068 | $13,620 |
| Standard Deviation (Population) | $19,974 | $13,383 |
Similar Demographics by Median Family Income
Demographics Similar to Immigrants from Trinidad and Tobago by Median Family Income
In terms of median family income, the demographic groups most similar to Immigrants from Trinidad and Tobago are Barbadian ($93,919, a difference of 0.070%), Somali ($94,085, a difference of 0.10%), Salvadoran ($94,109, a difference of 0.13%), German Russian ($93,858, a difference of 0.14%), and Nepalese ($94,153, a difference of 0.17%).
| Demographics | Rating | Rank | Median Family Income |
| Immigrants | Western Africa | 1.6 /100 | #234 | Tragic $94,638 |
| Immigrants | Burma/Myanmar | 1.5 /100 | #235 | Tragic $94,472 |
| Trinidadians and Tobagonians | 1.5 /100 | #236 | Tragic $94,466 |
| Alaskan Athabascans | 1.5 /100 | #237 | Tragic $94,429 |
| Nepalese | 1.3 /100 | #238 | Tragic $94,153 |
| Salvadorans | 1.2 /100 | #239 | Tragic $94,109 |
| Somalis | 1.2 /100 | #240 | Tragic $94,085 |
| Immigrants | Trinidad and Tobago | 1.2 /100 | #241 | Tragic $93,988 |
| Barbadians | 1.1 /100 | #242 | Tragic $93,919 |
| German Russians | 1.1 /100 | #243 | Tragic $93,858 |
| Sub-Saharan Africans | 1.0 /100 | #244 | Tragic $93,748 |
| Immigrants | Middle Africa | 1.0 /100 | #245 | Tragic $93,593 |
| Guyanese | 0.9 /100 | #246 | Tragic $93,373 |
| Immigrants | Senegal | 0.7 /100 | #247 | Tragic $92,912 |
| French American Indians | 0.7 /100 | #248 | Tragic $92,872 |
Demographics Similar to Comanche by Median Family Income
In terms of median family income, the demographic groups most similar to Comanche are Blackfeet ($88,717, a difference of 0.18%), Bangladeshi ($88,358, a difference of 0.22%), Indonesian ($88,301, a difference of 0.29%), Guatemalan ($88,295, a difference of 0.29%), and Immigrants from Nicaragua ($88,267, a difference of 0.33%).
| Demographics | Rating | Rank | Median Family Income |
| Immigrants | St. Vincent and the Grenadines | 0.2 /100 | #275 | Tragic $90,094 |
| Immigrants | Zaire | 0.1 /100 | #276 | Tragic $89,285 |
| Immigrants | Jamaica | 0.1 /100 | #277 | Tragic $89,268 |
| Immigrants | Grenada | 0.1 /100 | #278 | Tragic $89,249 |
| Immigrants | Belize | 0.1 /100 | #279 | Tragic $89,197 |
| British West Indians | 0.1 /100 | #280 | Tragic $88,987 |
| Blackfeet | 0.1 /100 | #281 | Tragic $88,717 |
| Comanche | 0.1 /100 | #282 | Tragic $88,556 |
| Bangladeshis | 0.1 /100 | #283 | Tragic $88,358 |
| Indonesians | 0.1 /100 | #284 | Tragic $88,301 |
| Guatemalans | 0.1 /100 | #285 | Tragic $88,295 |
| Immigrants | Nicaragua | 0.1 /100 | #286 | Tragic $88,267 |
| Potawatomi | 0.1 /100 | #287 | Tragic $88,265 |
| Cherokee | 0.1 /100 | #288 | Tragic $88,209 |
| Central American Indians | 0.1 /100 | #289 | Tragic $88,034 |